View Final Result
Data Analysis
Highlights & Outcomes
The client, a prominent European multinational corporation, requested my team to assess the various design systems in use. The resulting analysis provided a comprehensive quantitative evaluation of the strengths and weaknesses of each design system, enabling the client to make an informed decision.
By being able to select a single design system as the reference, the client was able to :
Establish a cohesive foundation for design throughout the organisation.
Effectively leverage the strengths of other design systems to avoid losing valuable work.


How did I compare these design systems?
Due to the confidentiality agreement associated with this project, I will demonstrate the process rather than revealing actual data. For the sake of illustration, we will compare four Design Systems: A,B, C, and D.
Every design system was evaluated based on the following criteria:
Component Coverage
Documentation Quality
Adoption and User Satisfaction
Consistency and Cohesion
Scalability
Accessibility Compliance
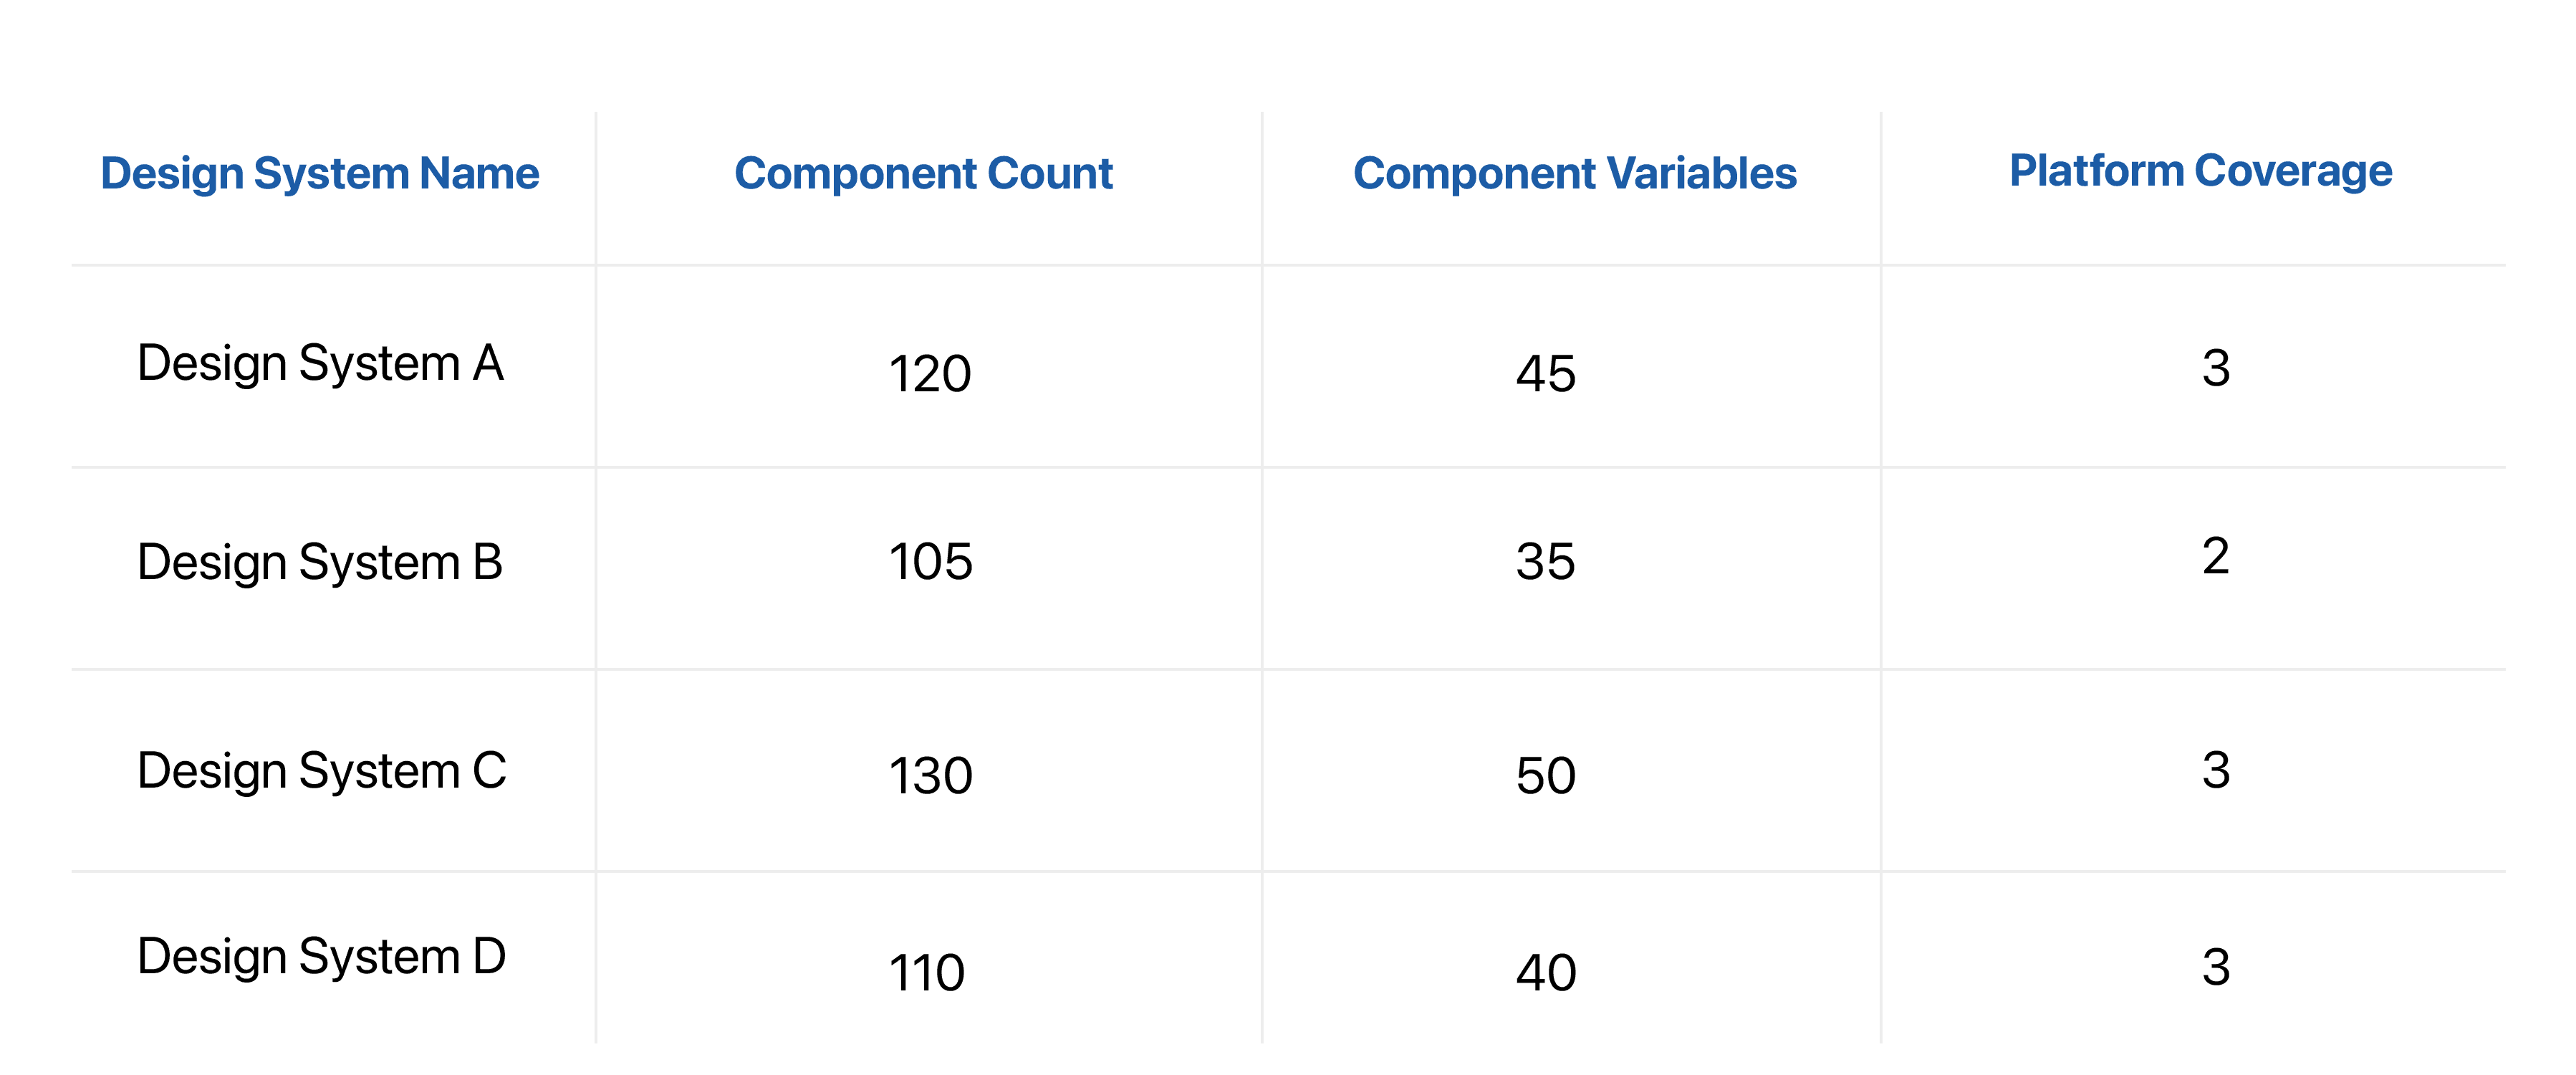
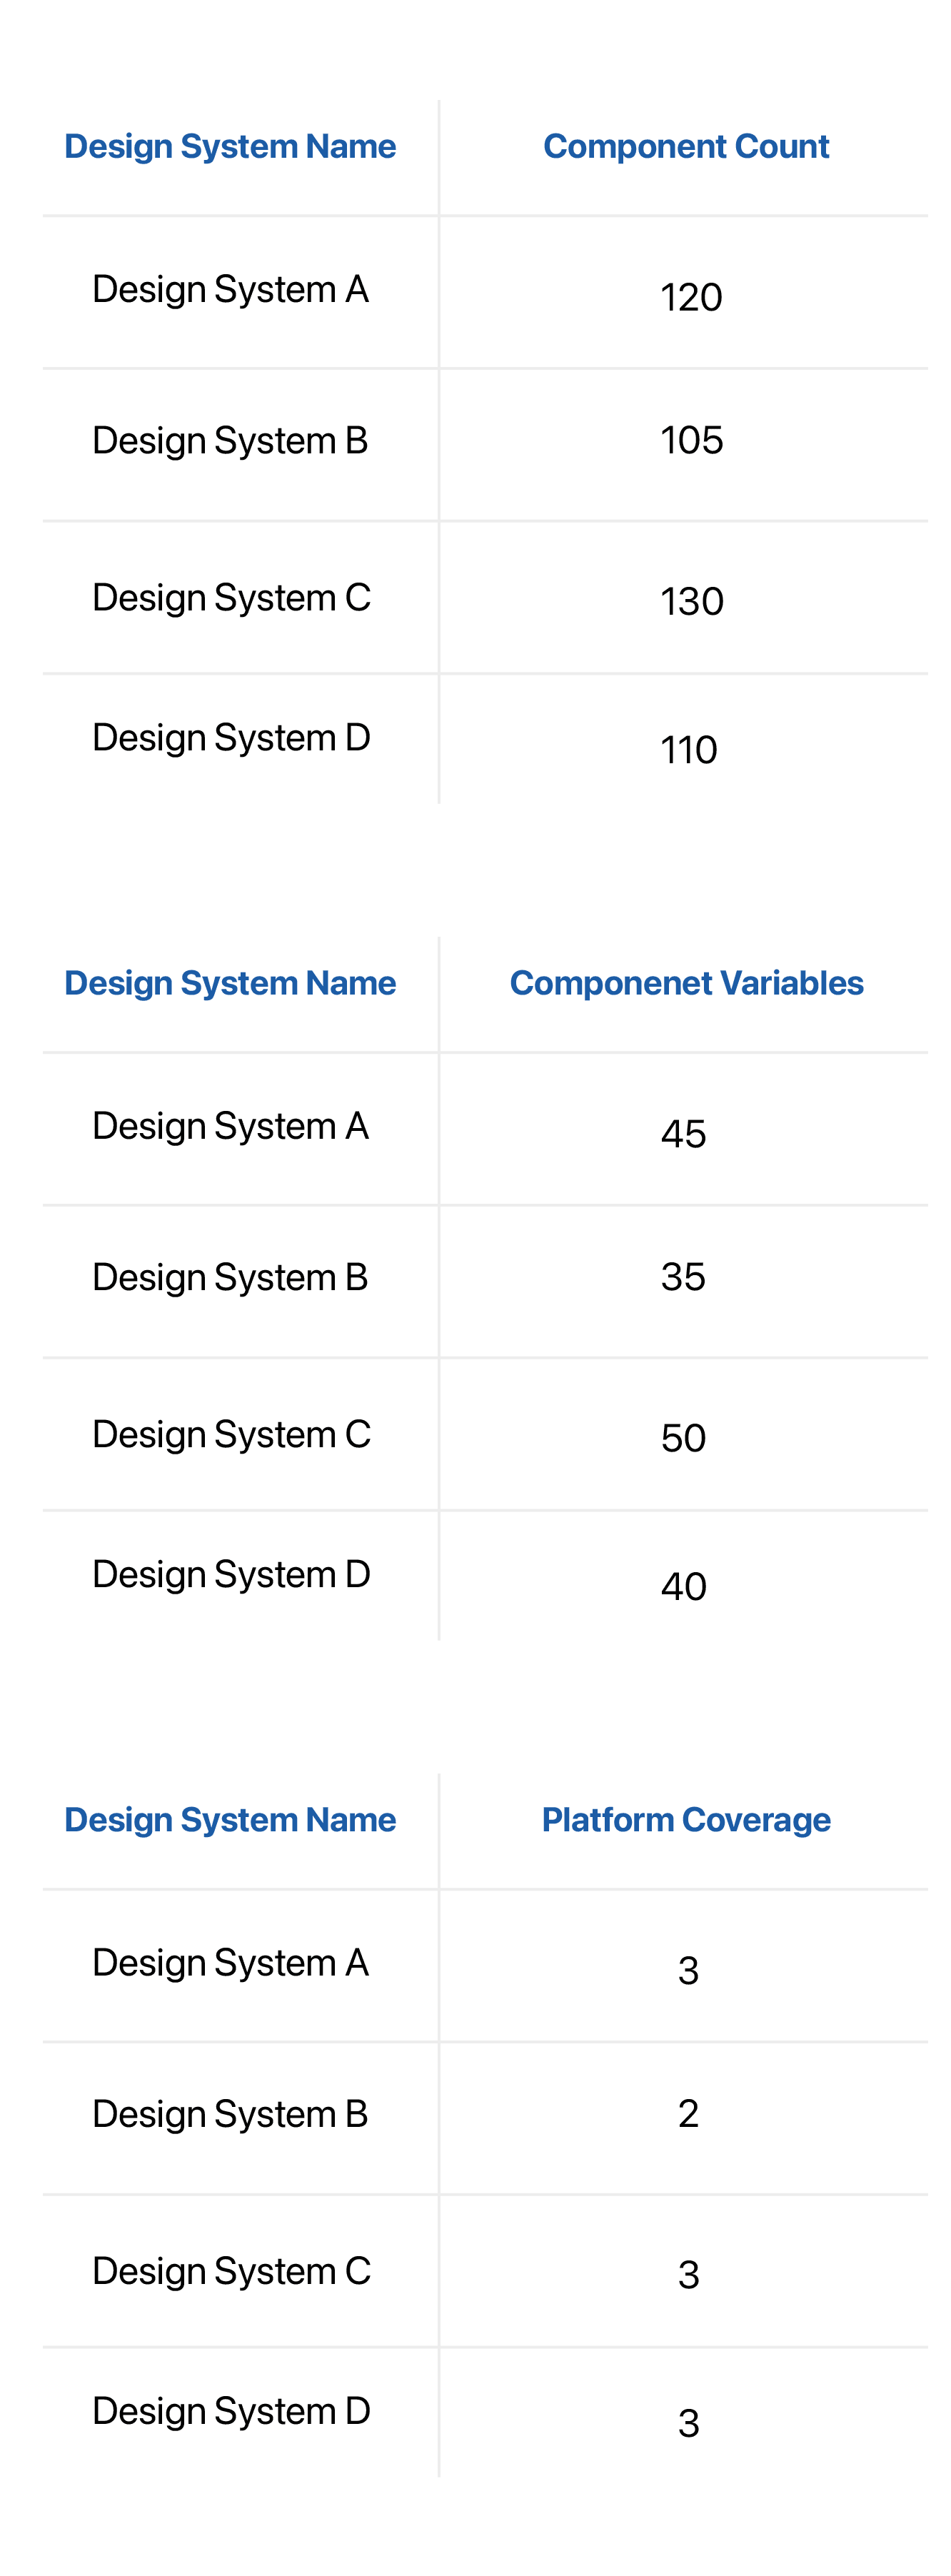
Component Coverage is about how well a design system supports user needs with its components. It looks at whether it provides all the essential building blocks, their variations, and if they work seamlessly across different platforms.
The component coverage score for each design system was determined based on the following metrics.


Component Coverage Scores
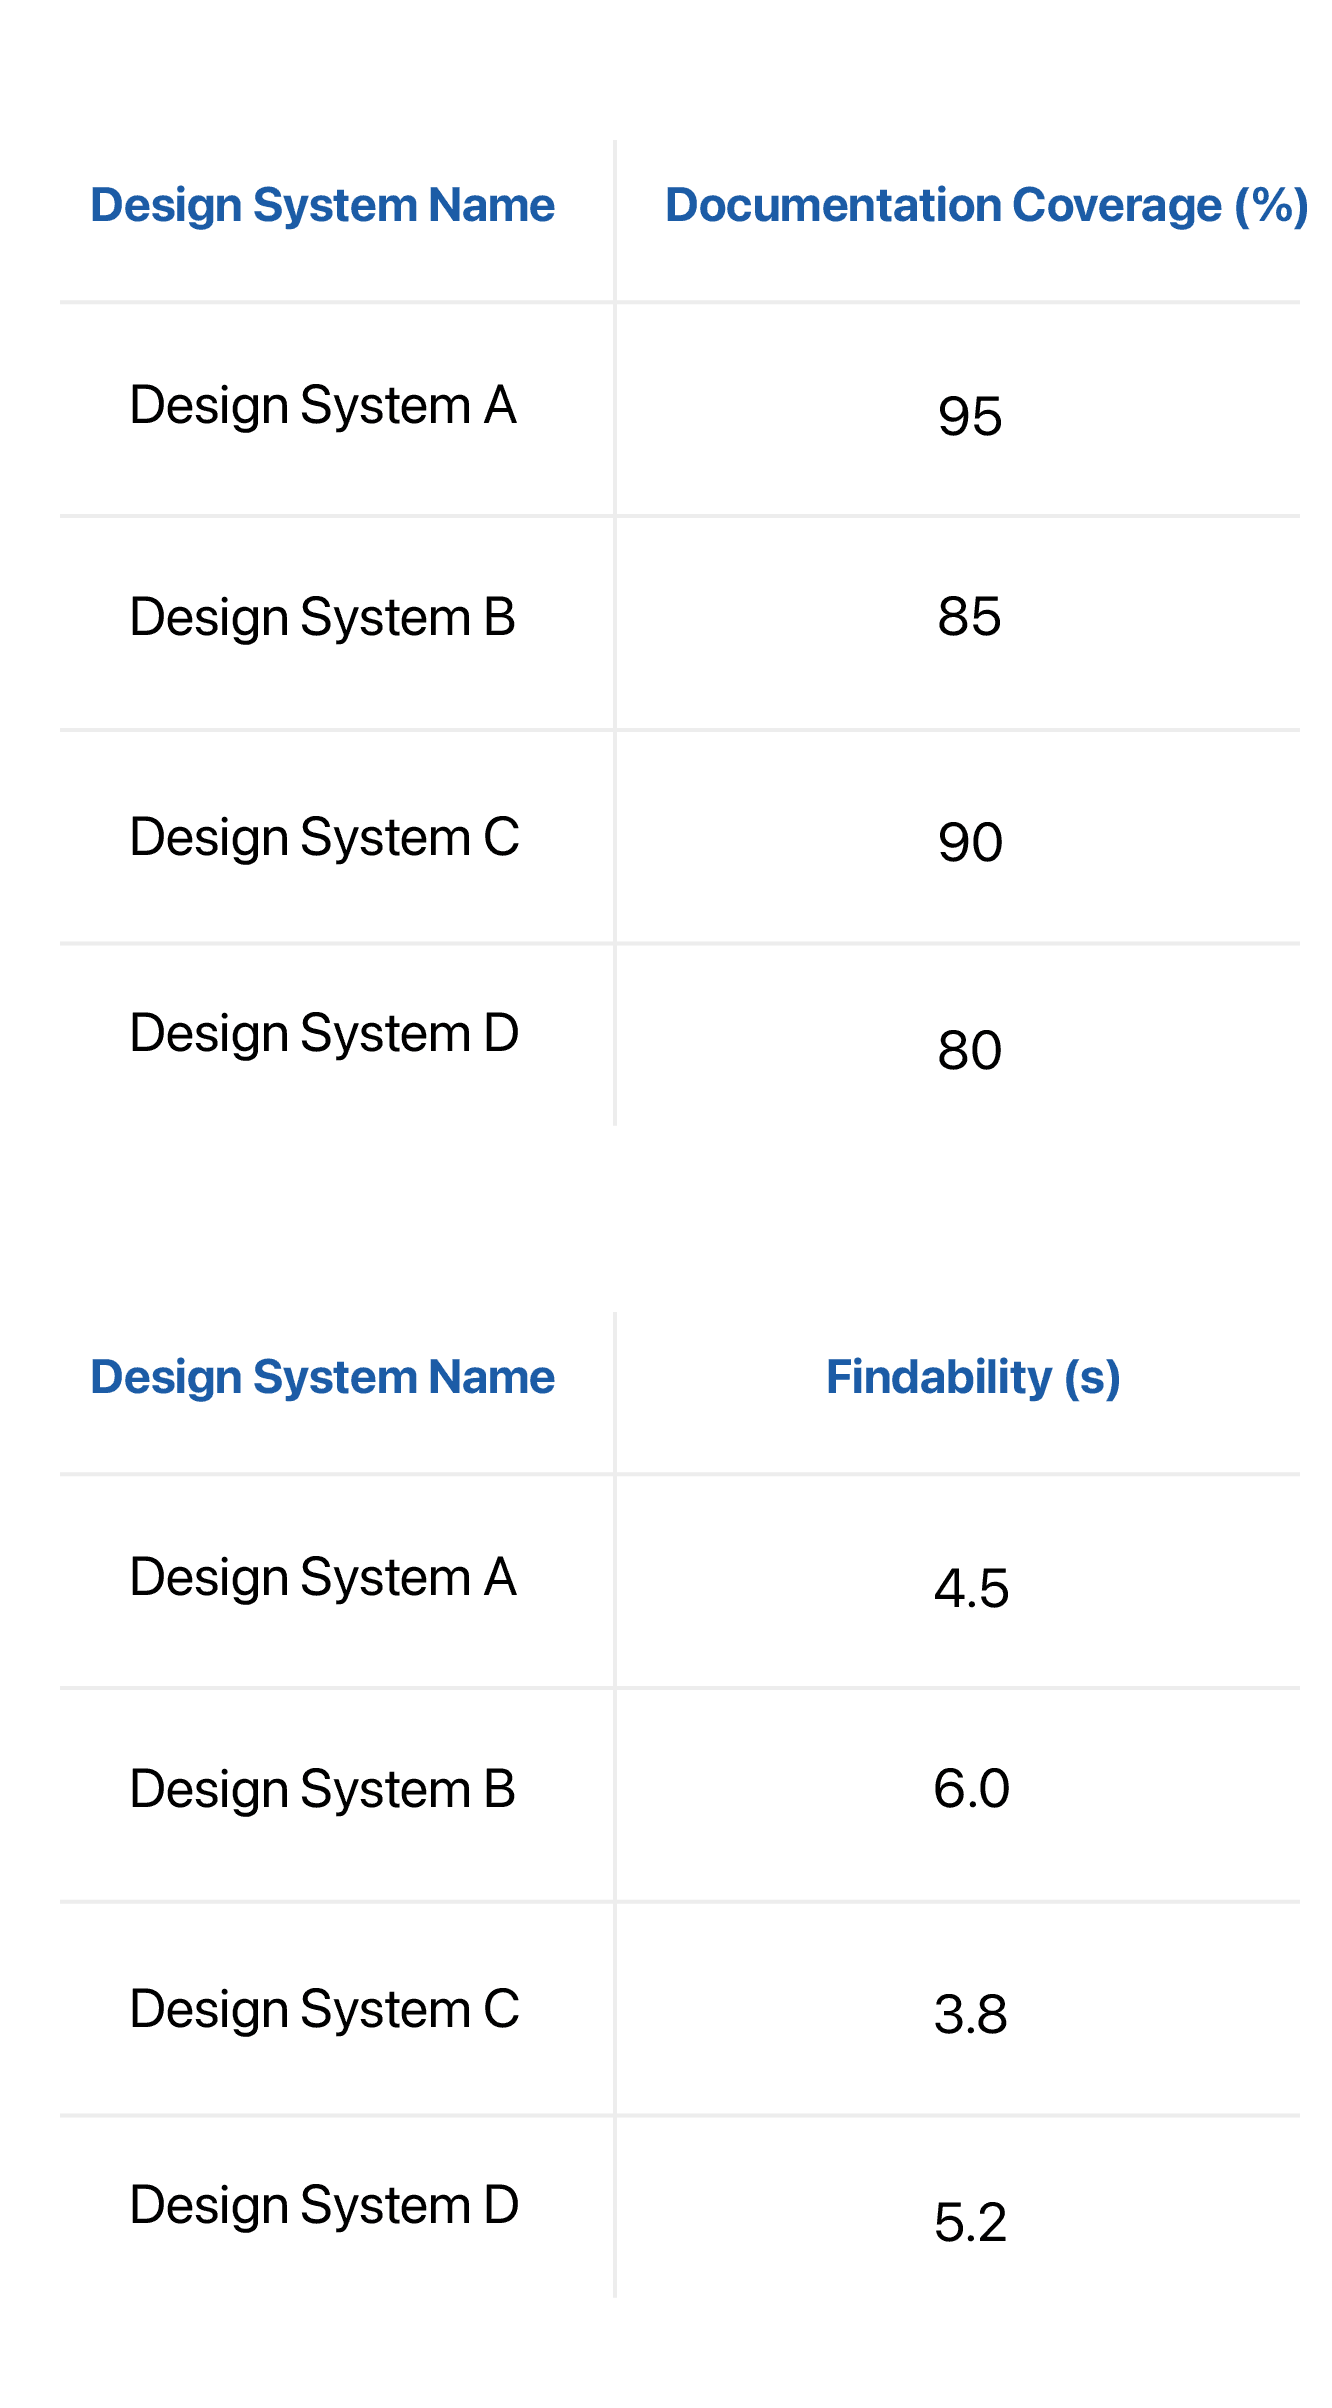
Documentation Quality
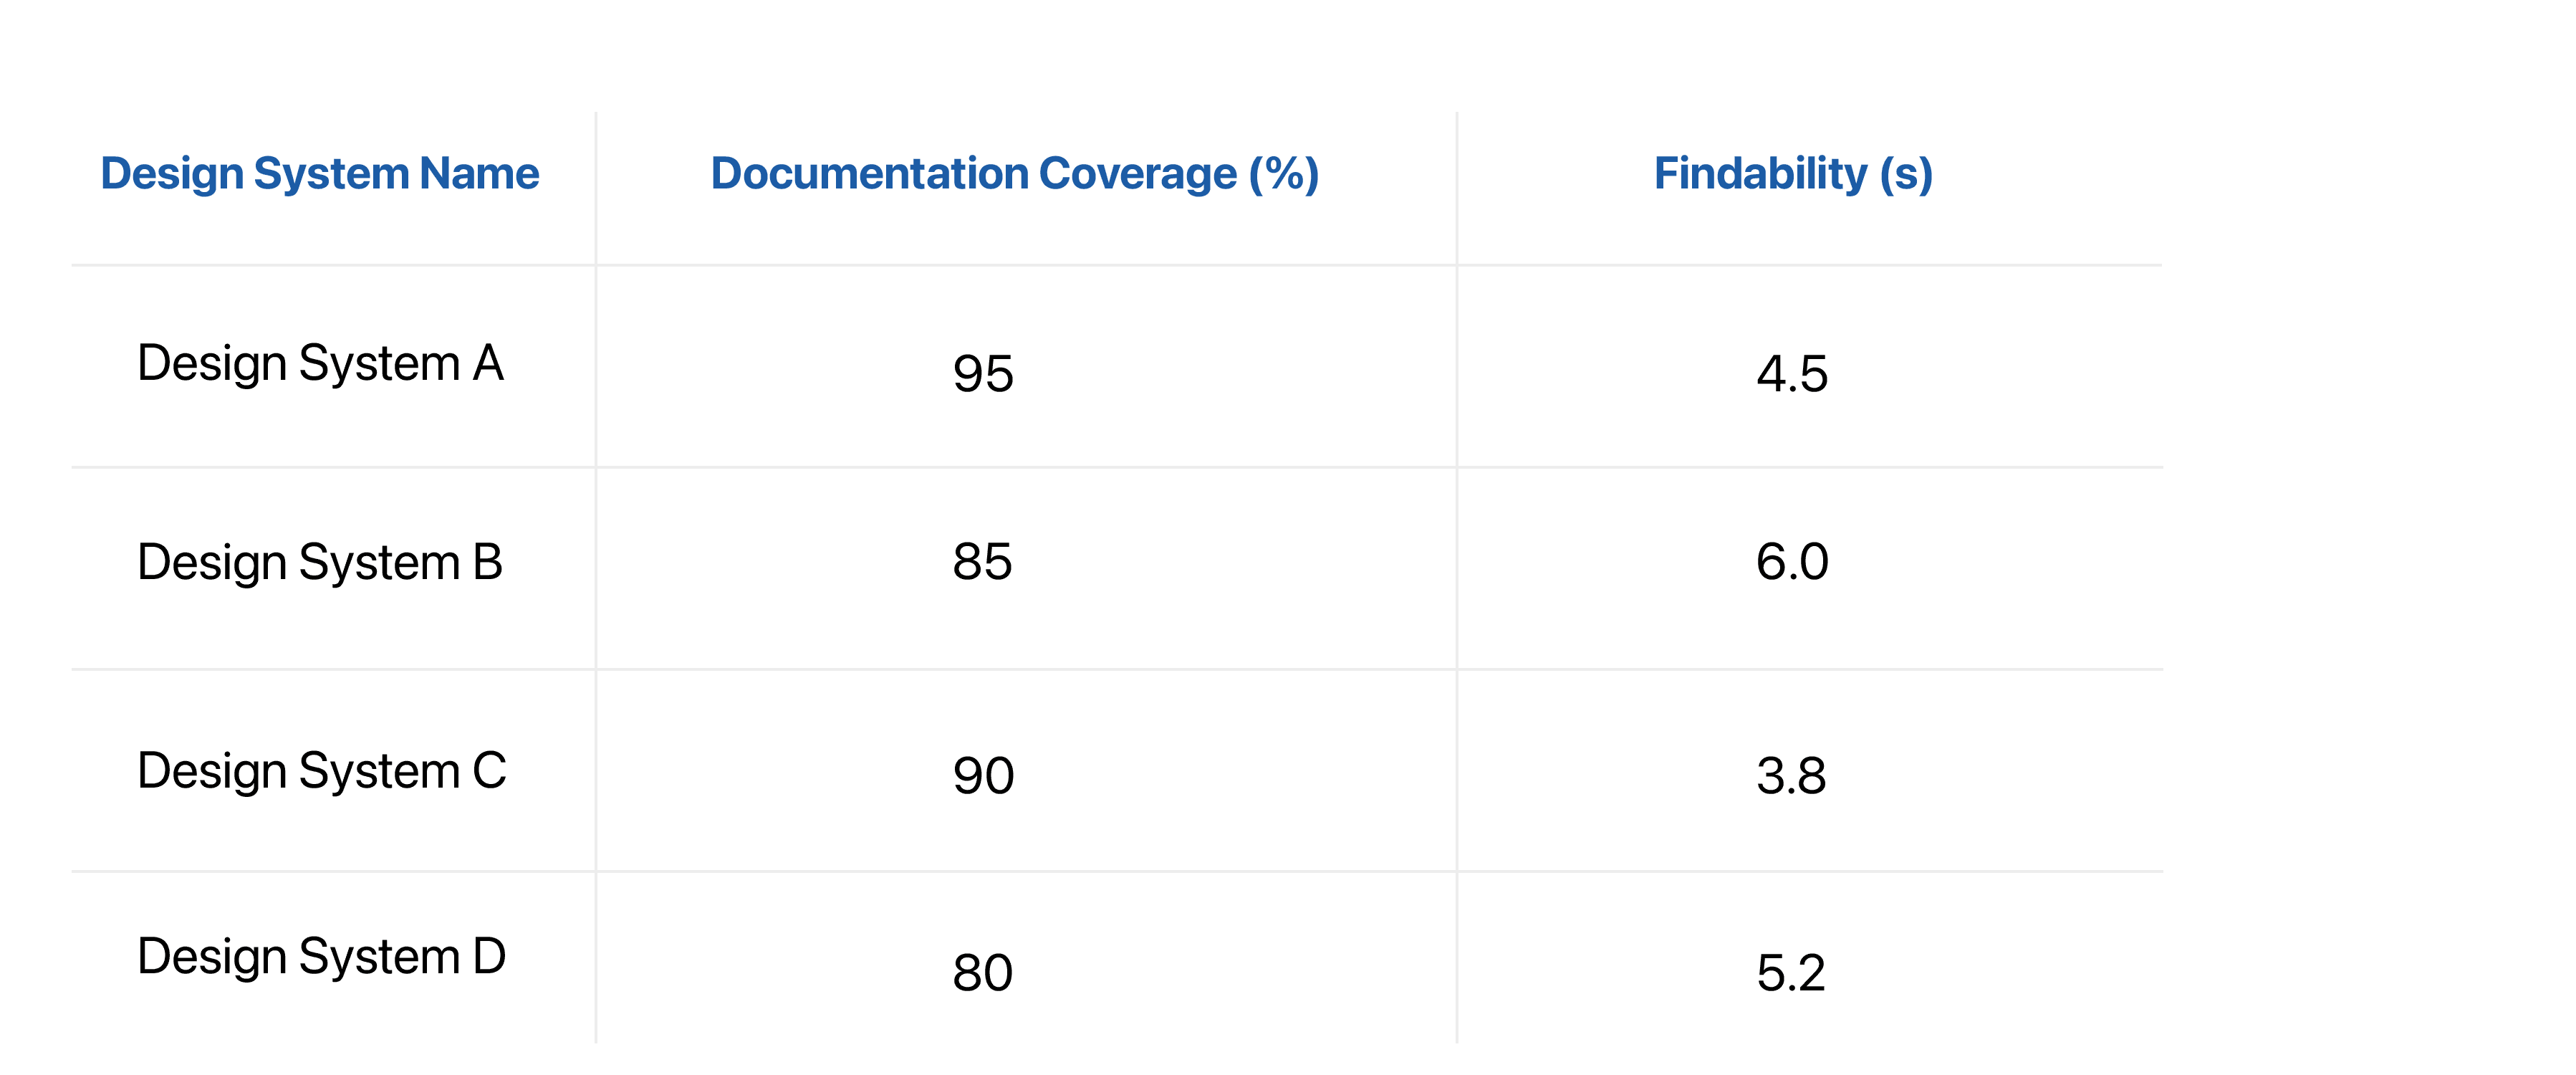
Documentation Quality assesses how comprehensive and accessible a design system's guidelines are. It ensures users can easily find and implement the necessary resources.
The documentation quality score for each design system was determined based on the following metrics.


Documentation Quality Scores
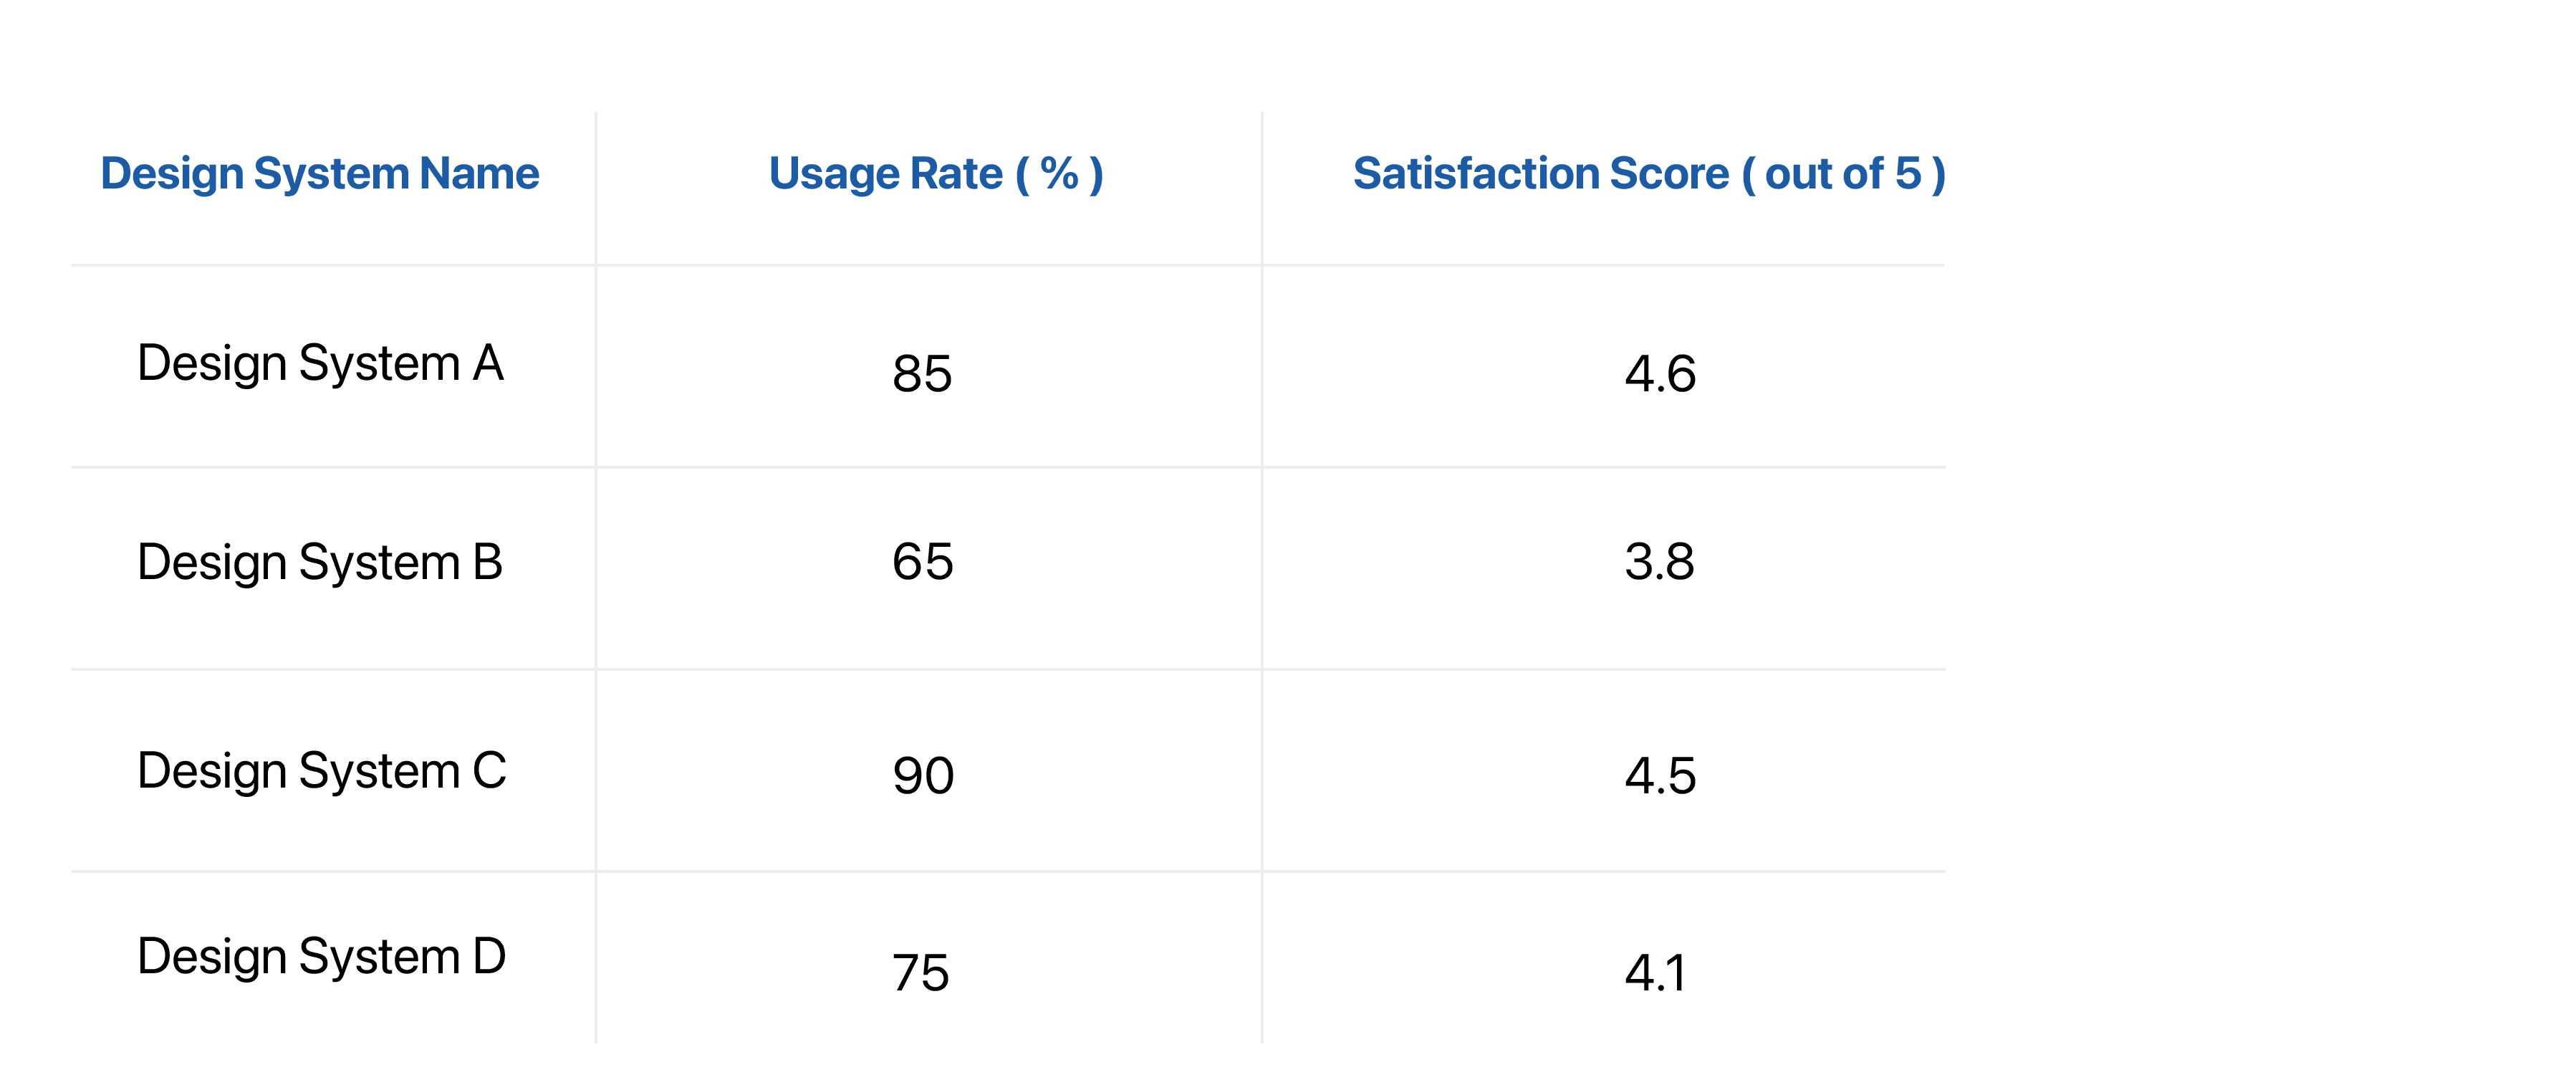
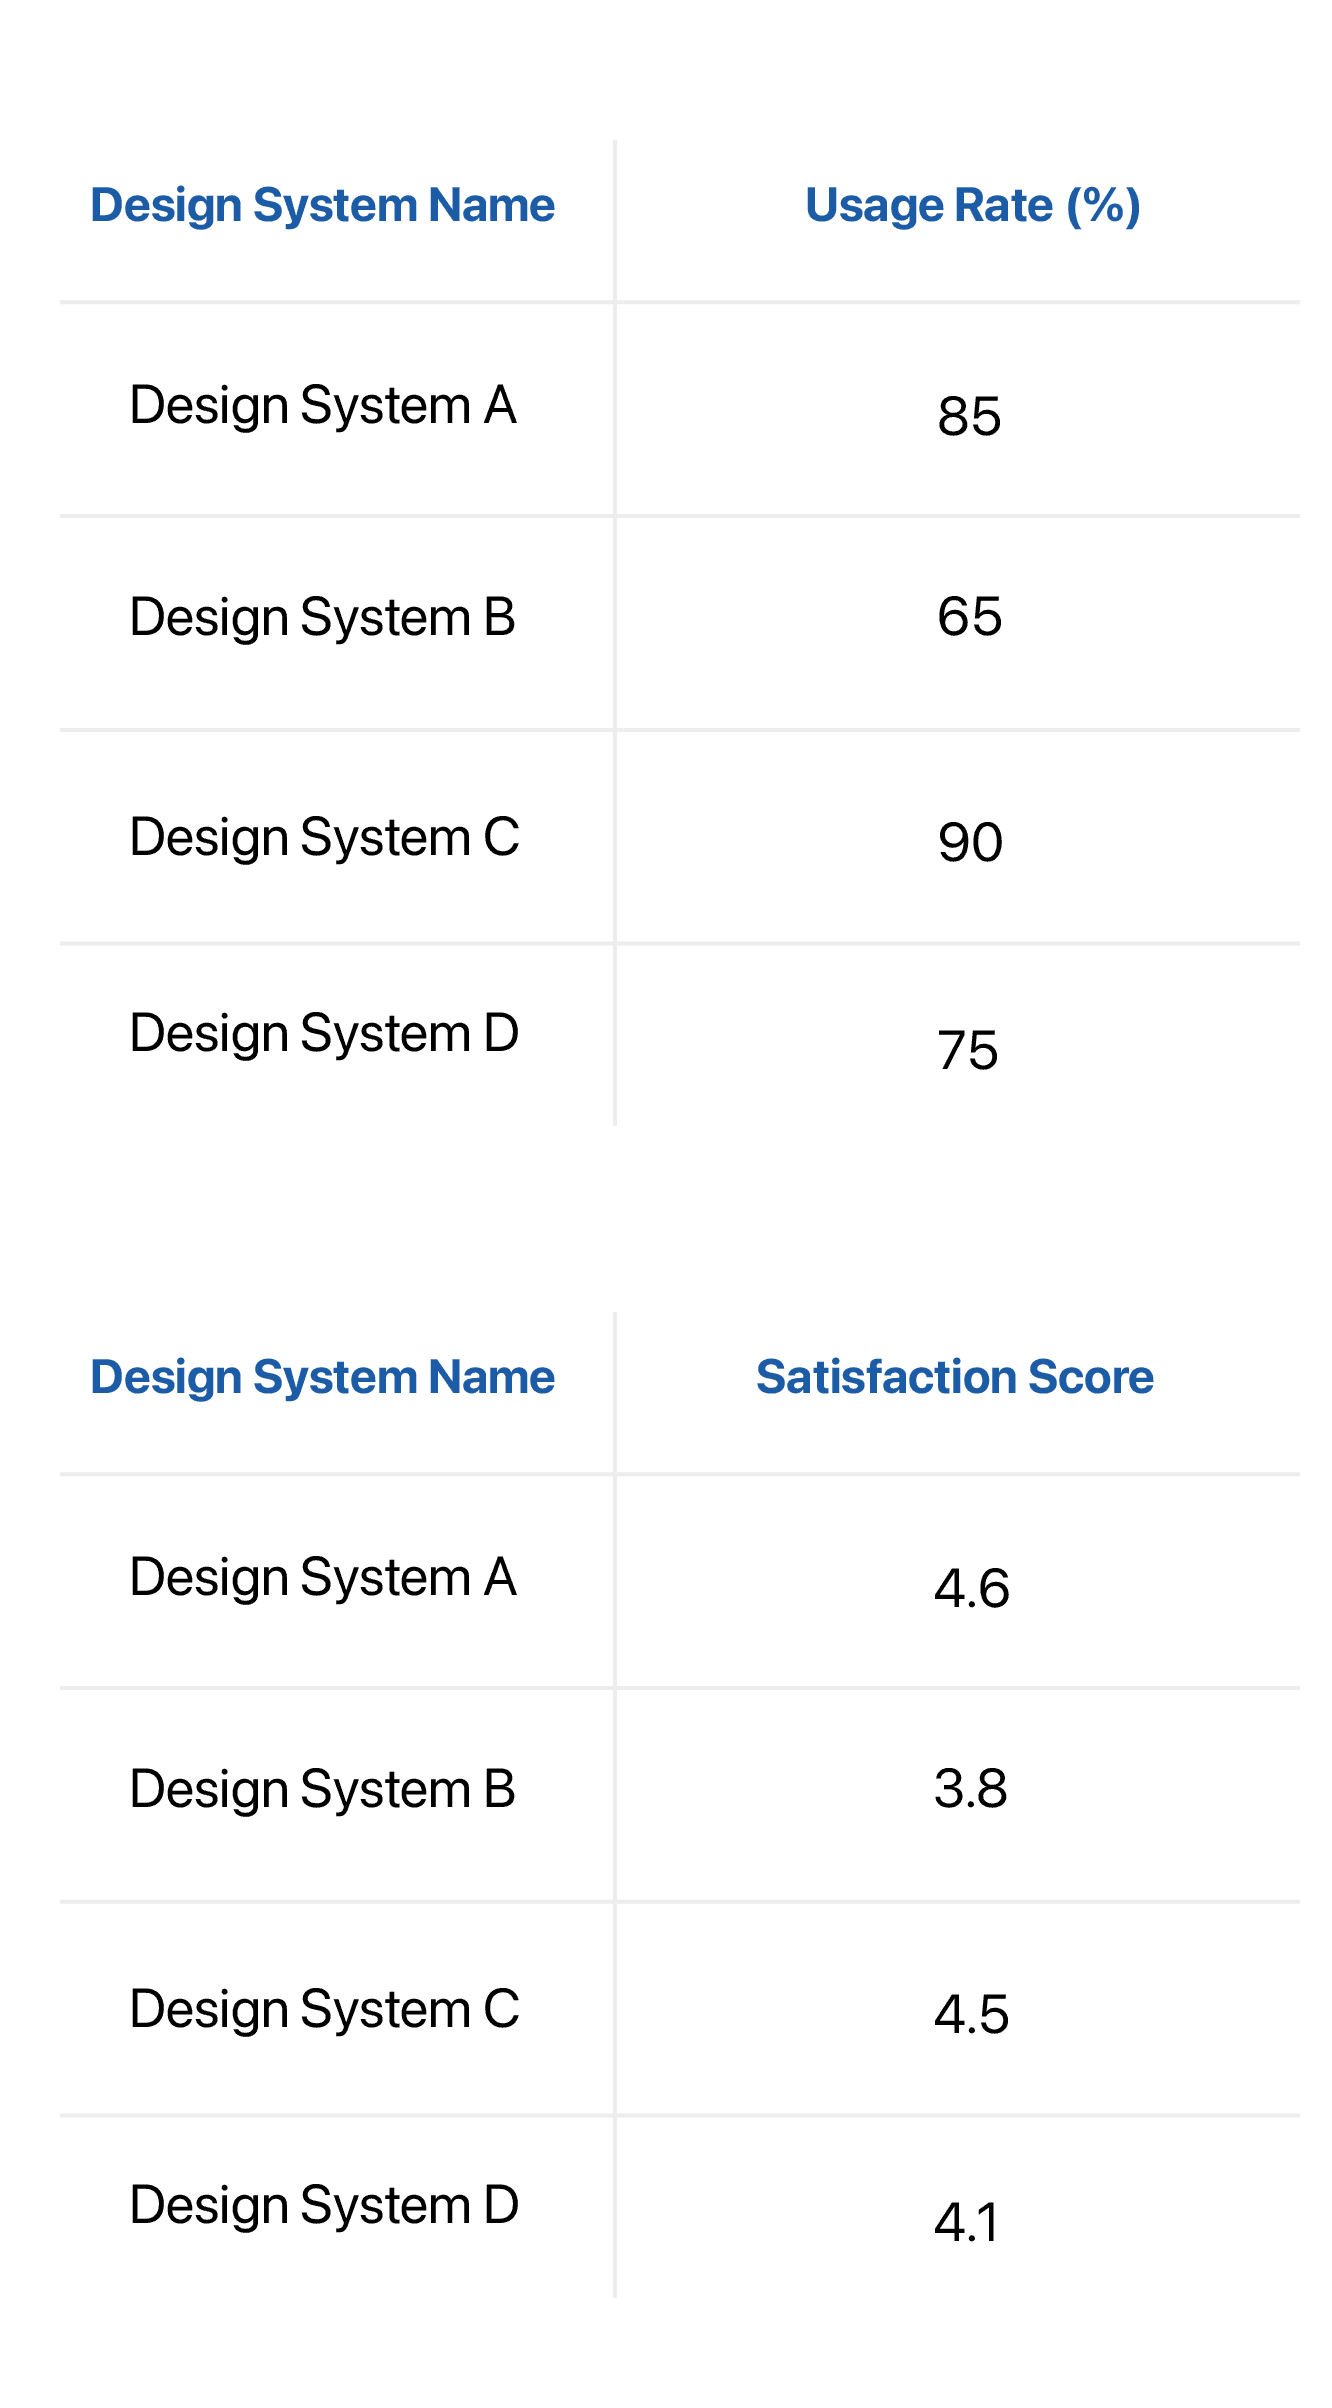
Adoption and User Satisfaction
Adoption and User Satisfaction evaluates the utilization of a design system and assesses user ratings regarding ease of use and its alignment with their workflows.
The adoption and user satisfaction score for each design system was determined based on the following metrics.


Adoption and User Satisfaction Scores
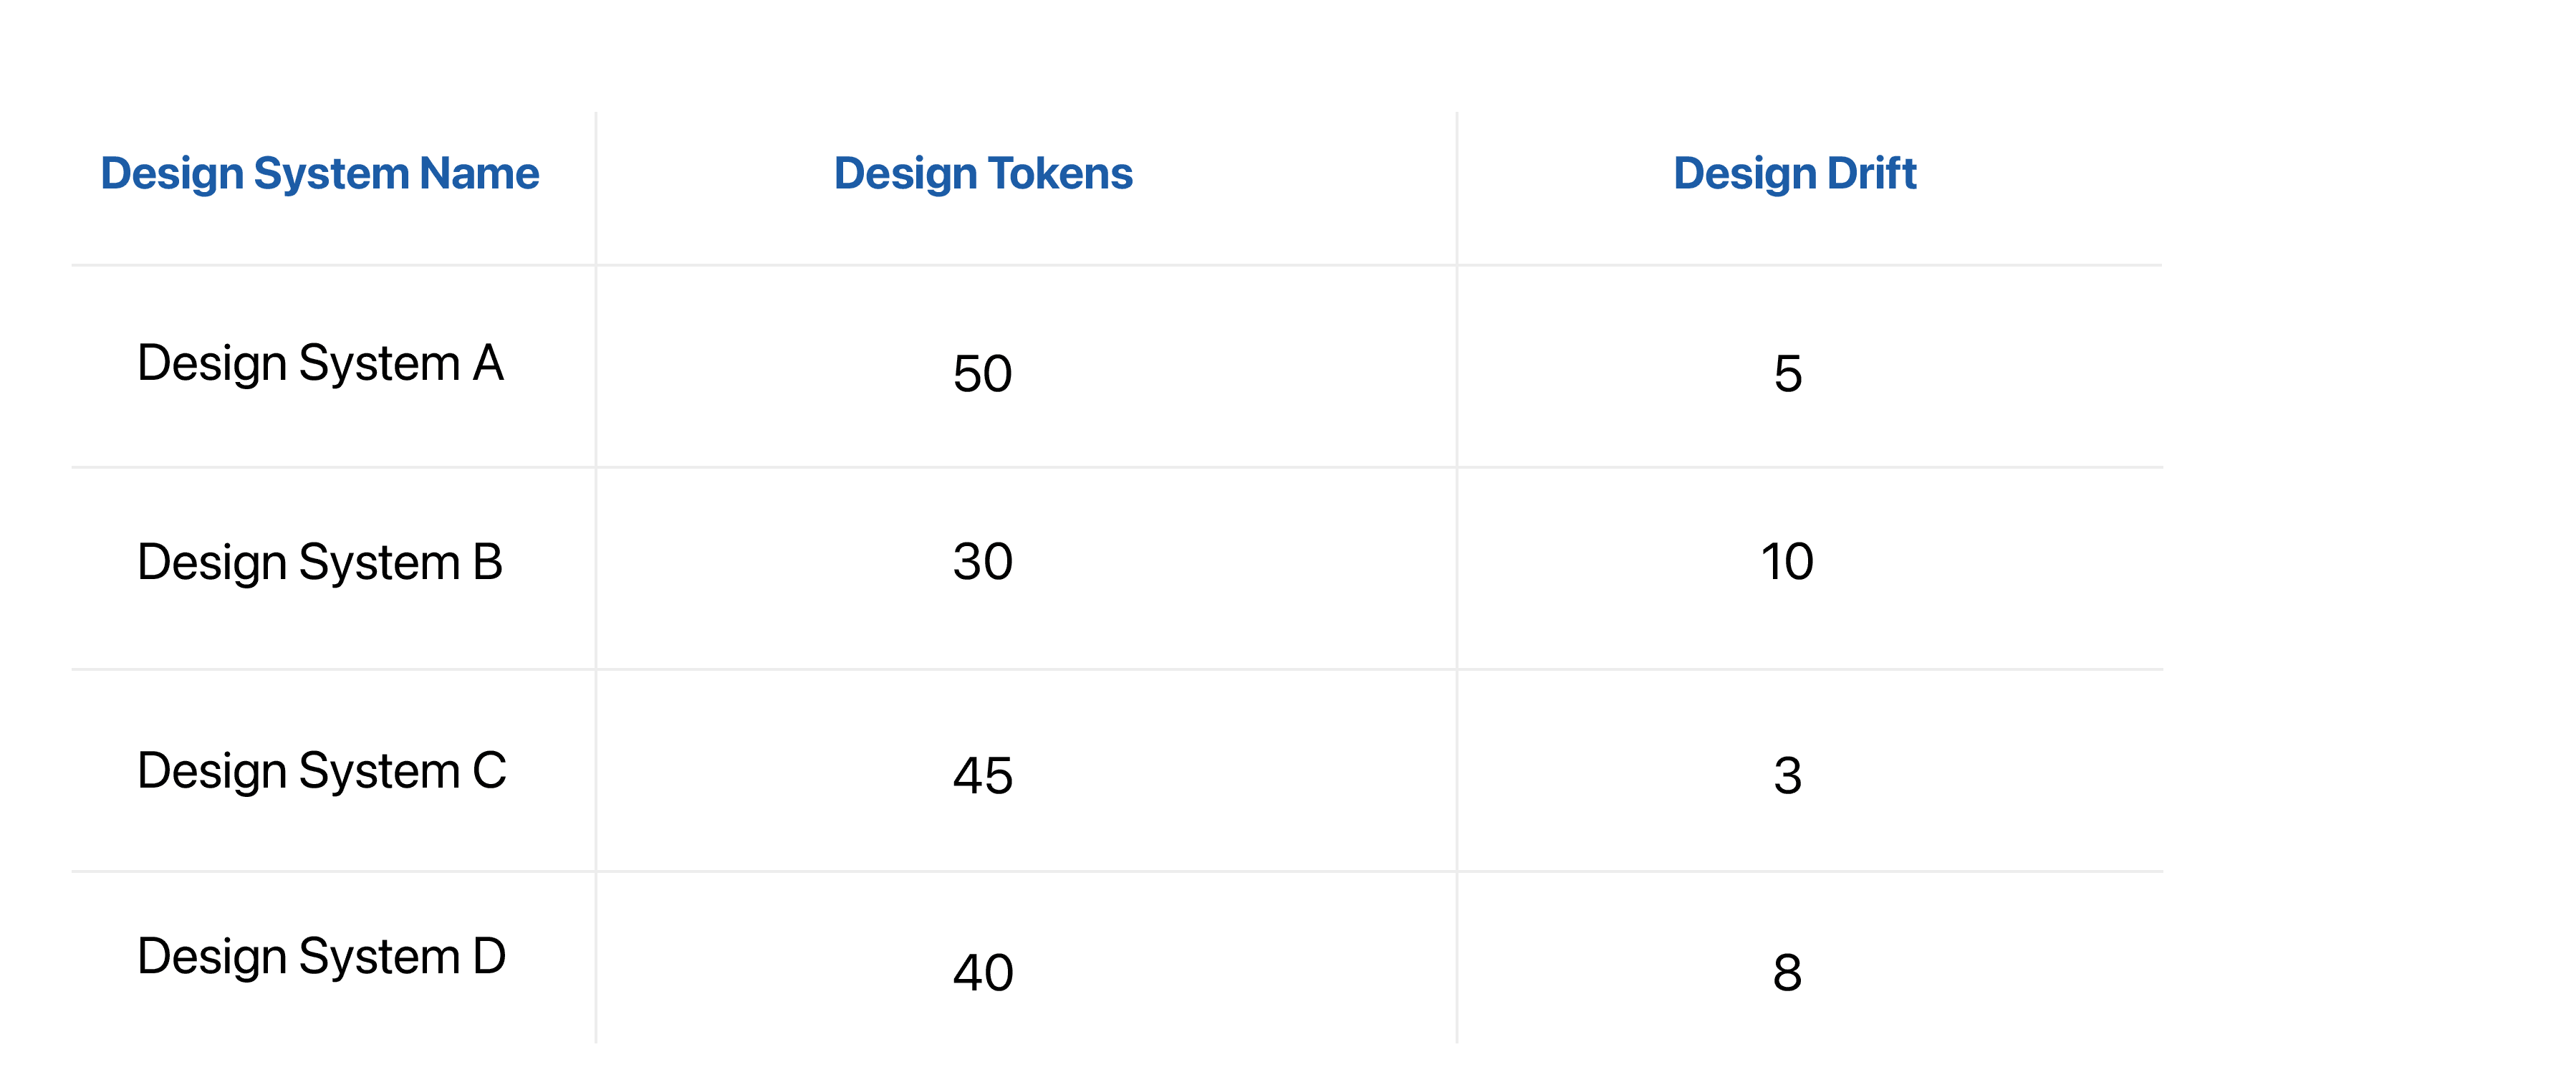
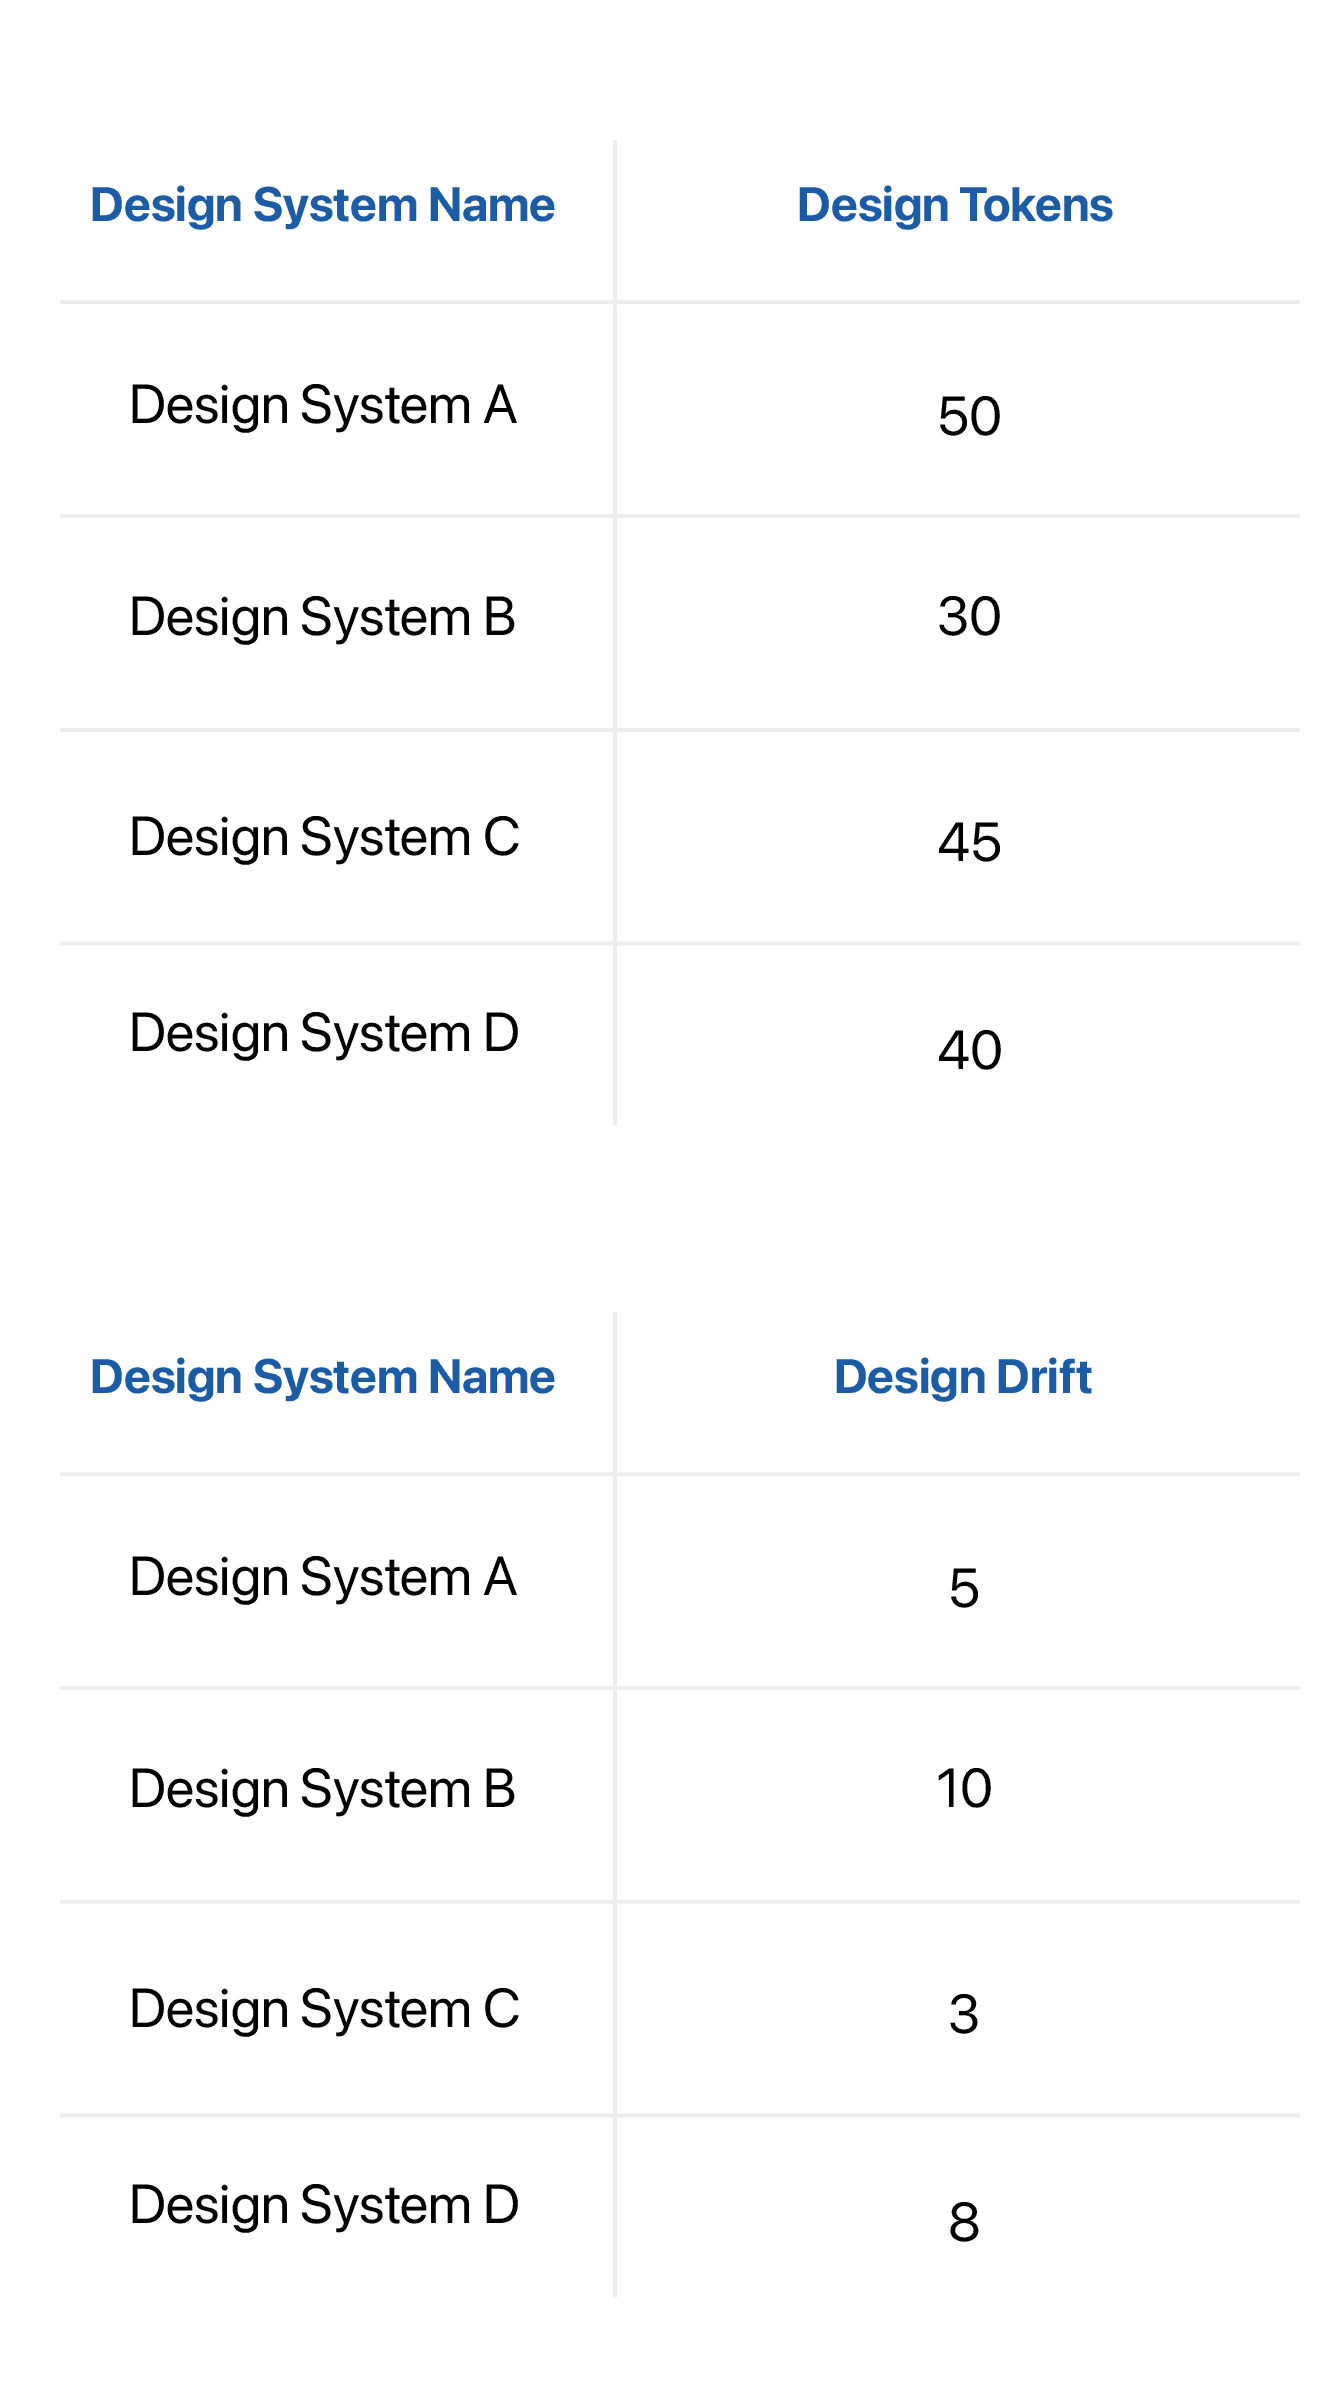
Consistency and Cohesion
This metric measures how well the design system maintains visual and functional harmony. It enables a unified experience across products
The consistency and cohesion score for each design system was determined based on the following metrics.


Consistency and Cohesion Scores
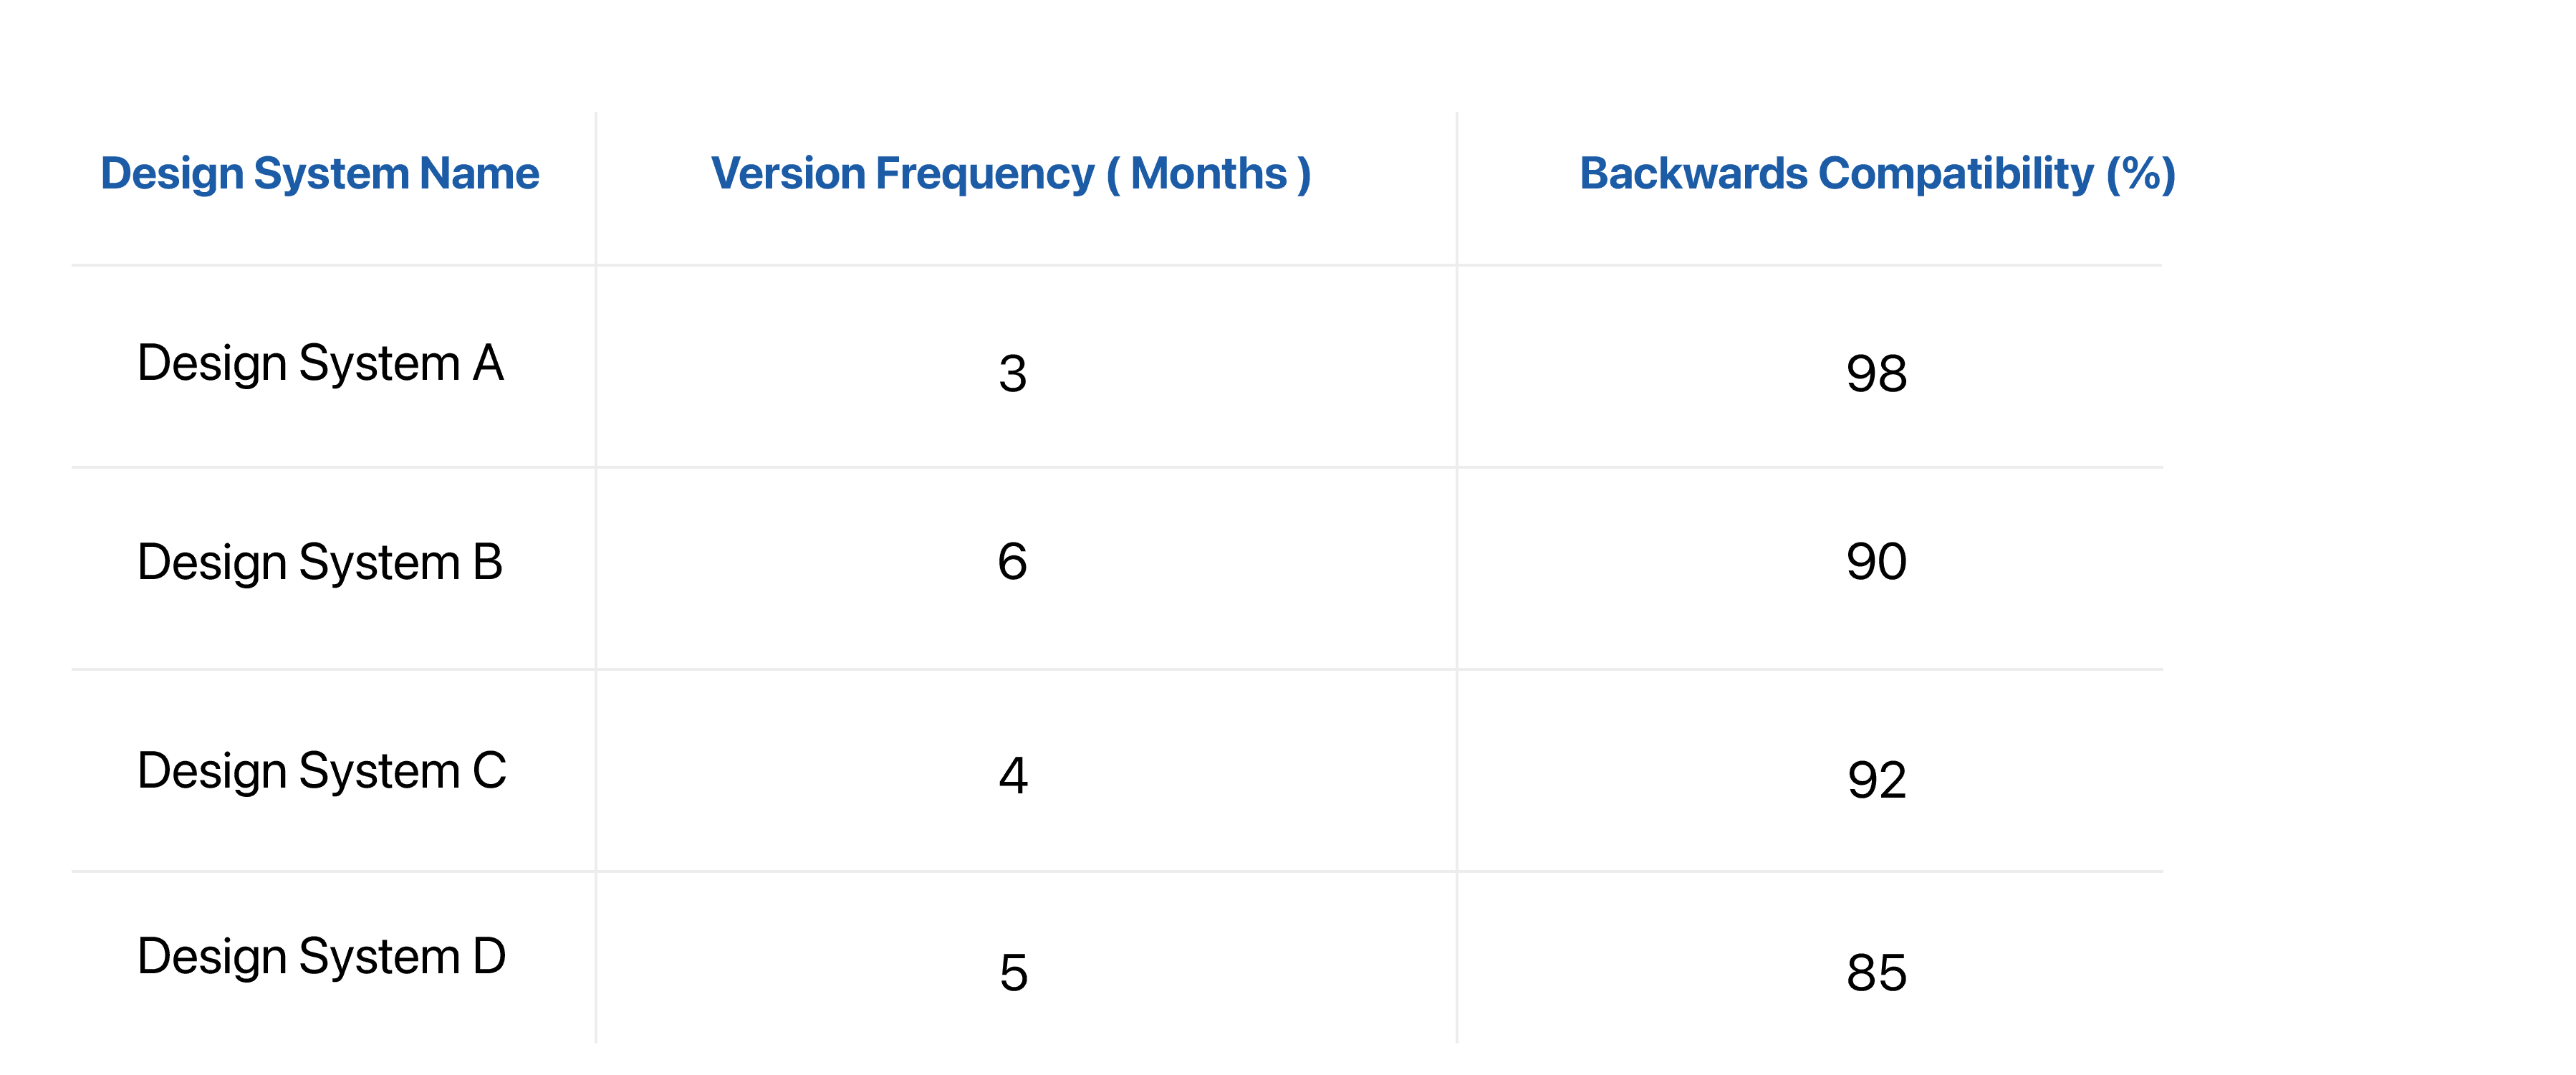
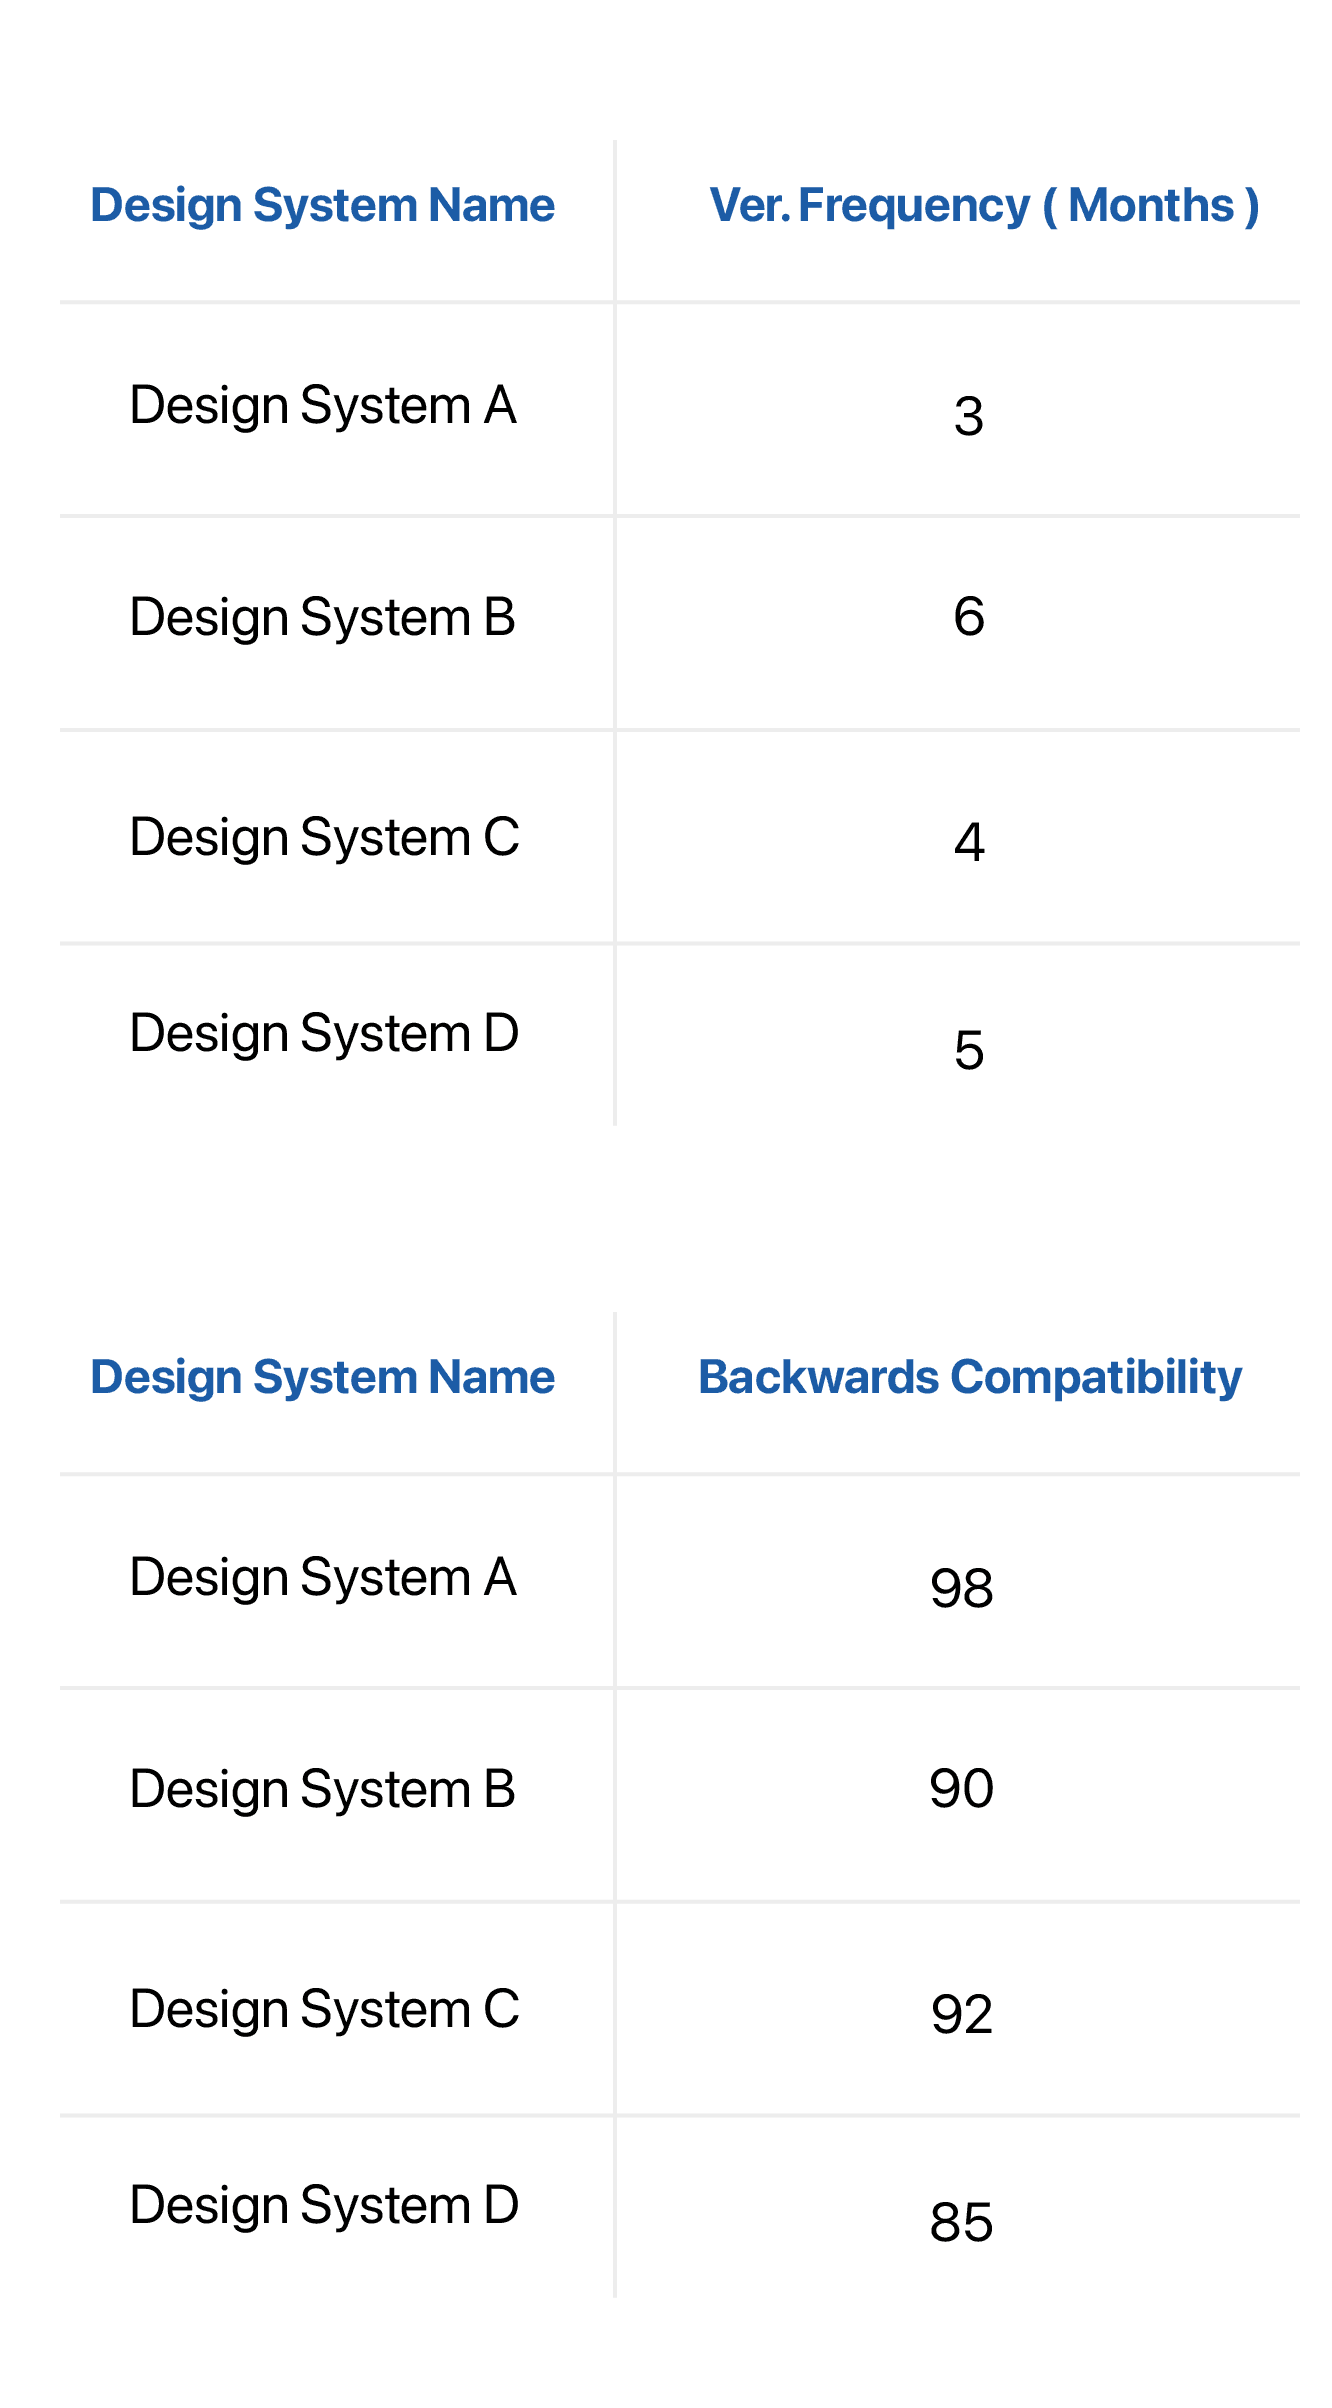
Scalability
Scalability measures a design systems capabiltiy to grow and adapt to changing needs. It focuses on seamless updates, versioning and backwards compatibility.
The scalability score for each design system was determined based on the following metrics.


Scalability Scores
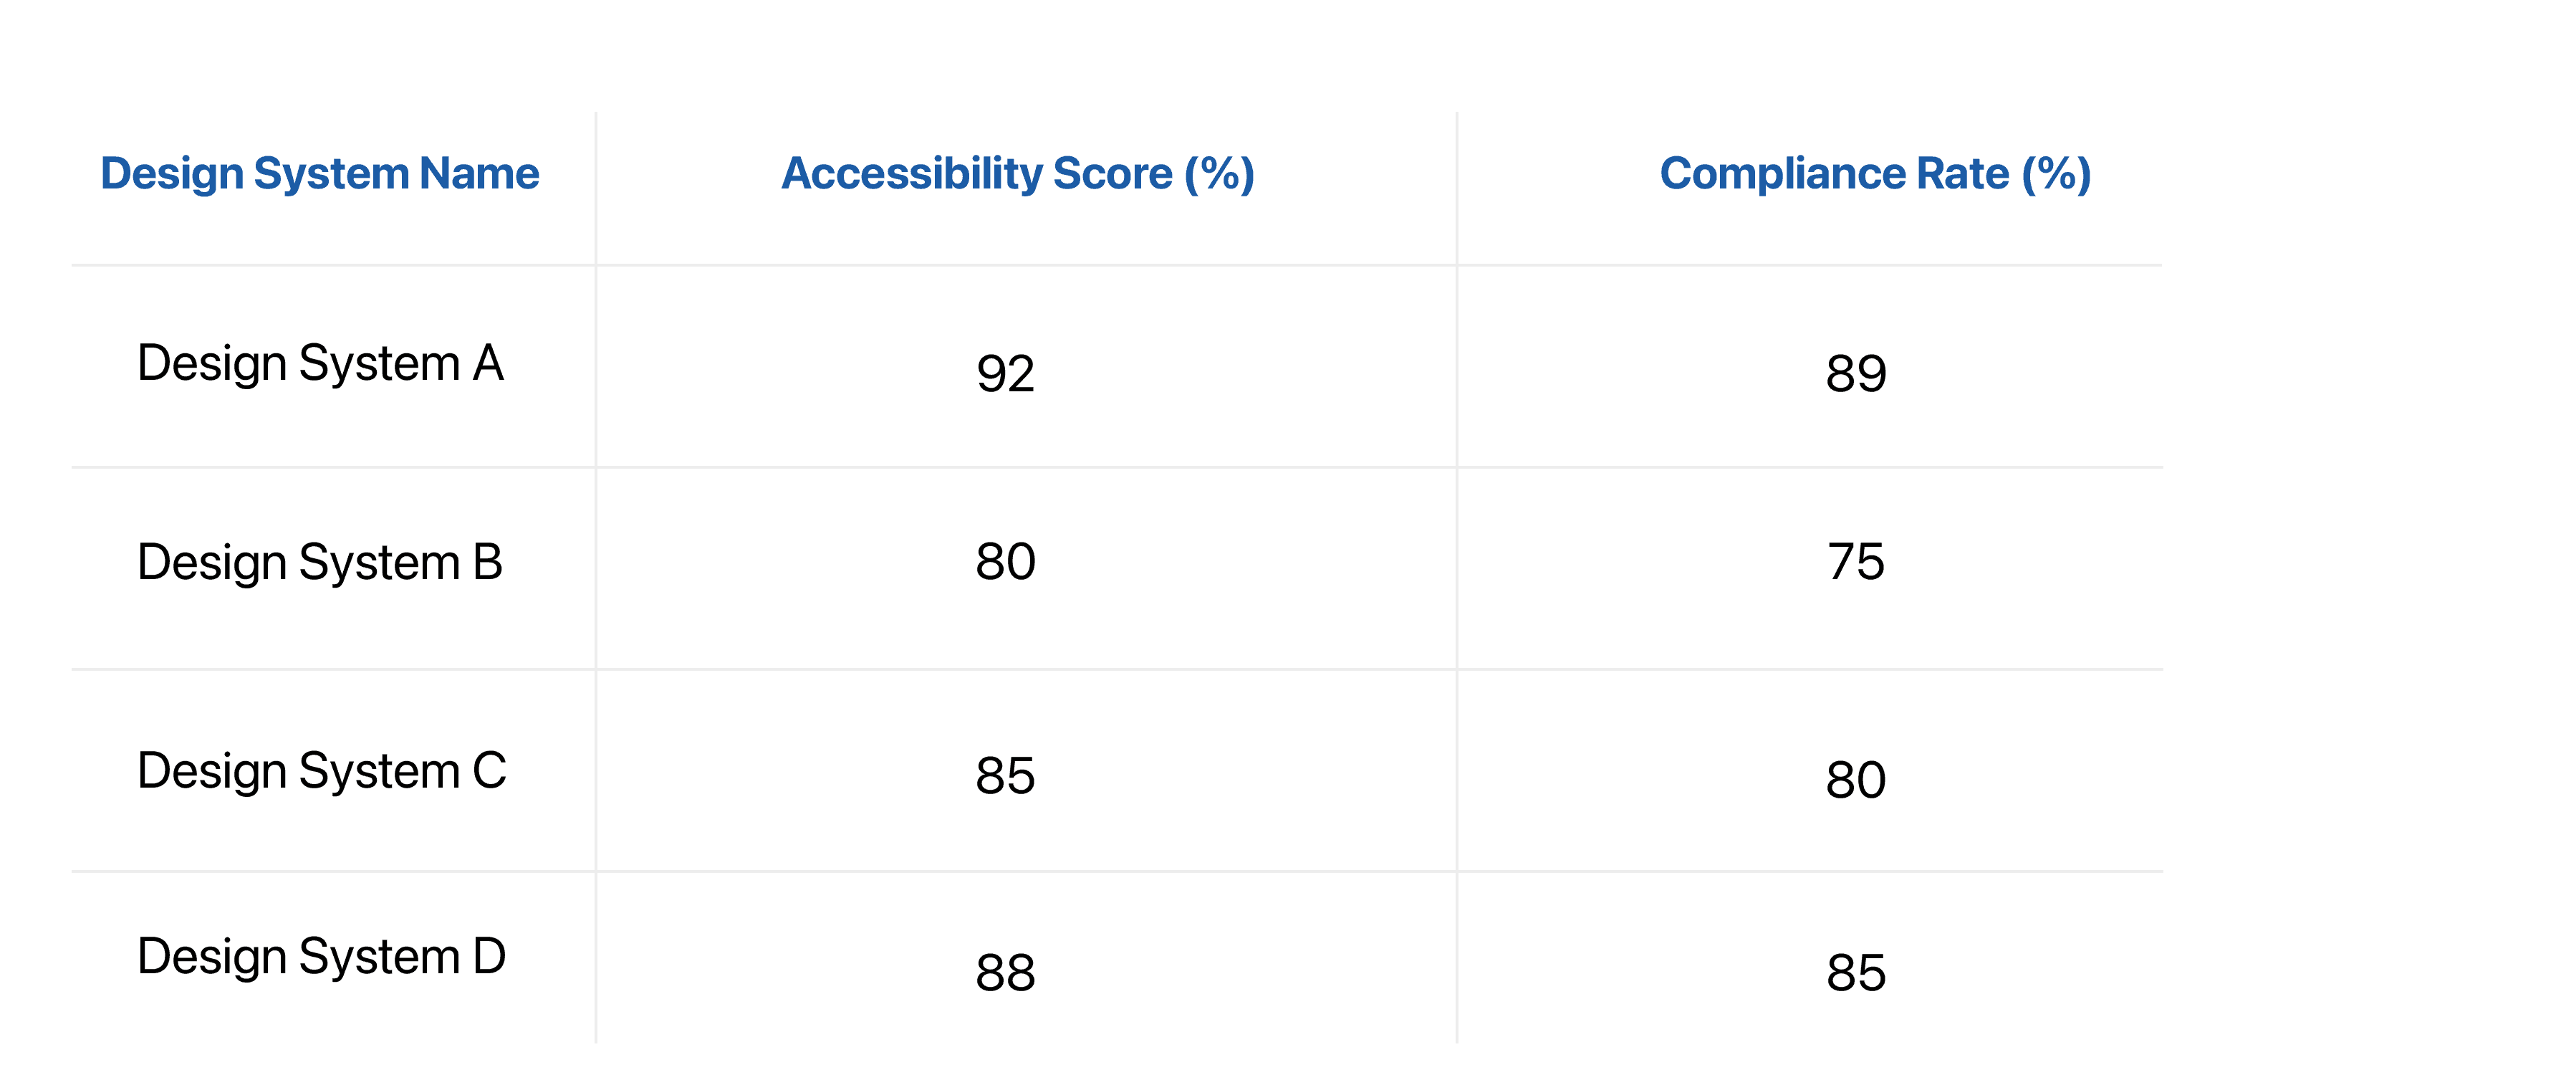
Accessibility Compliance
Accessibility compliance measures how well a design system meets inclusivity standards. It ensures that the products built using the design system are usable by individuals with varying abilities.
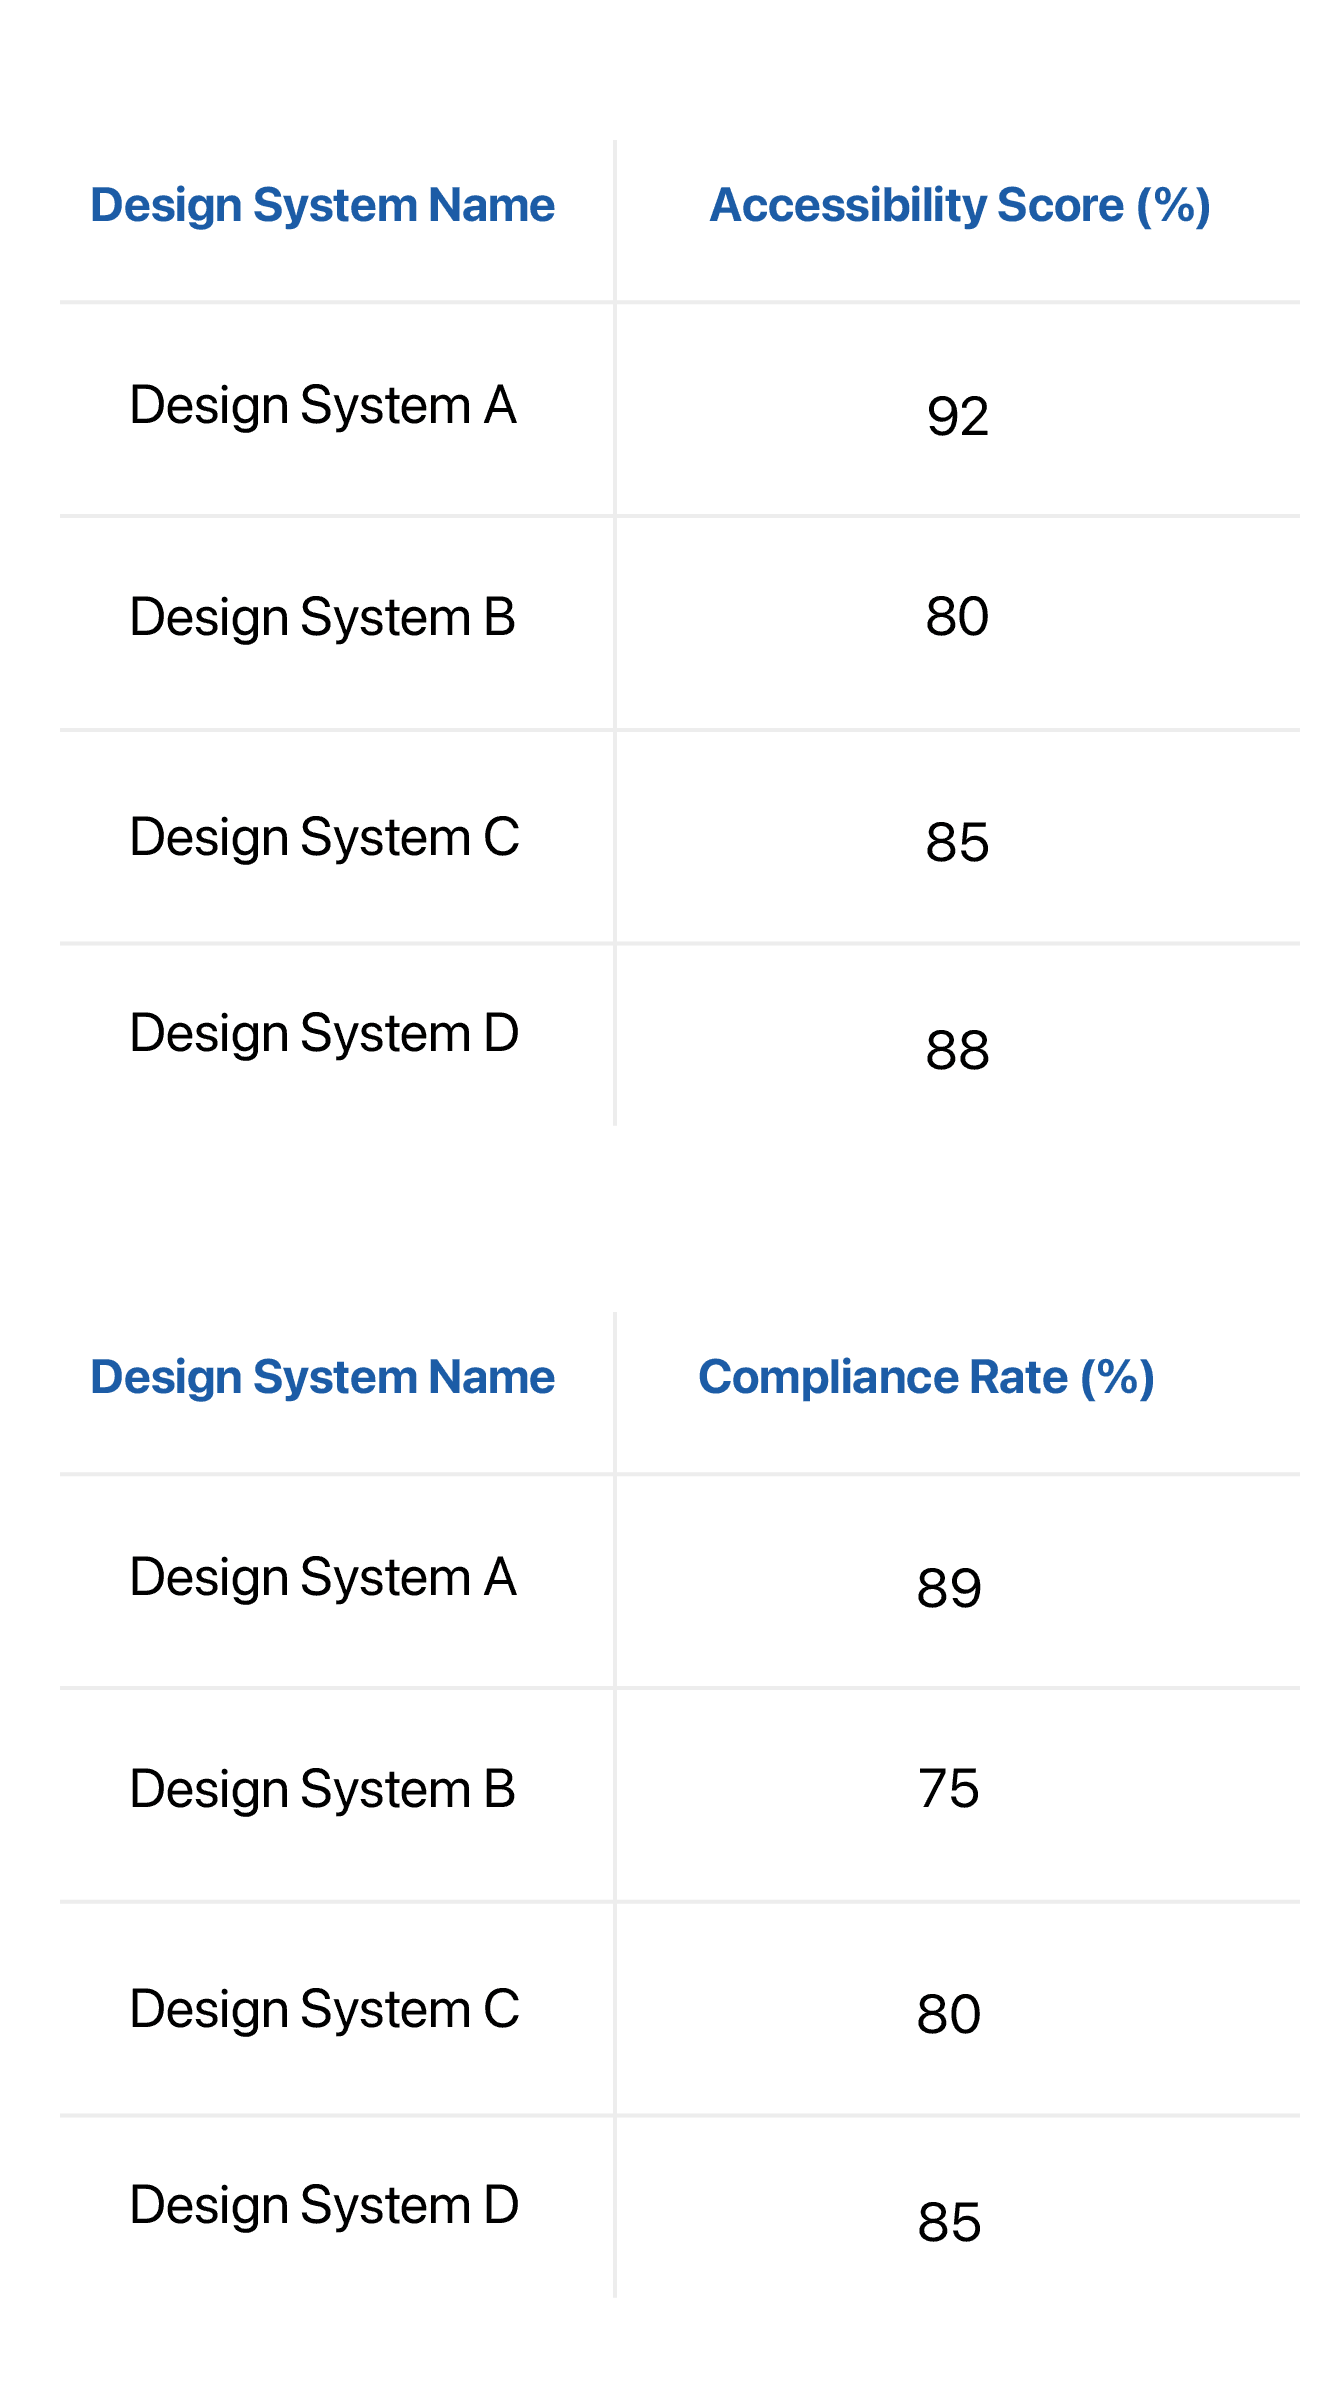
The accessibility compliance score for each design system was determined based on the following metrics.


Accessibility Compliance Scores
What did I do with all this data?
After collecting data on every design system I used it to do the following :
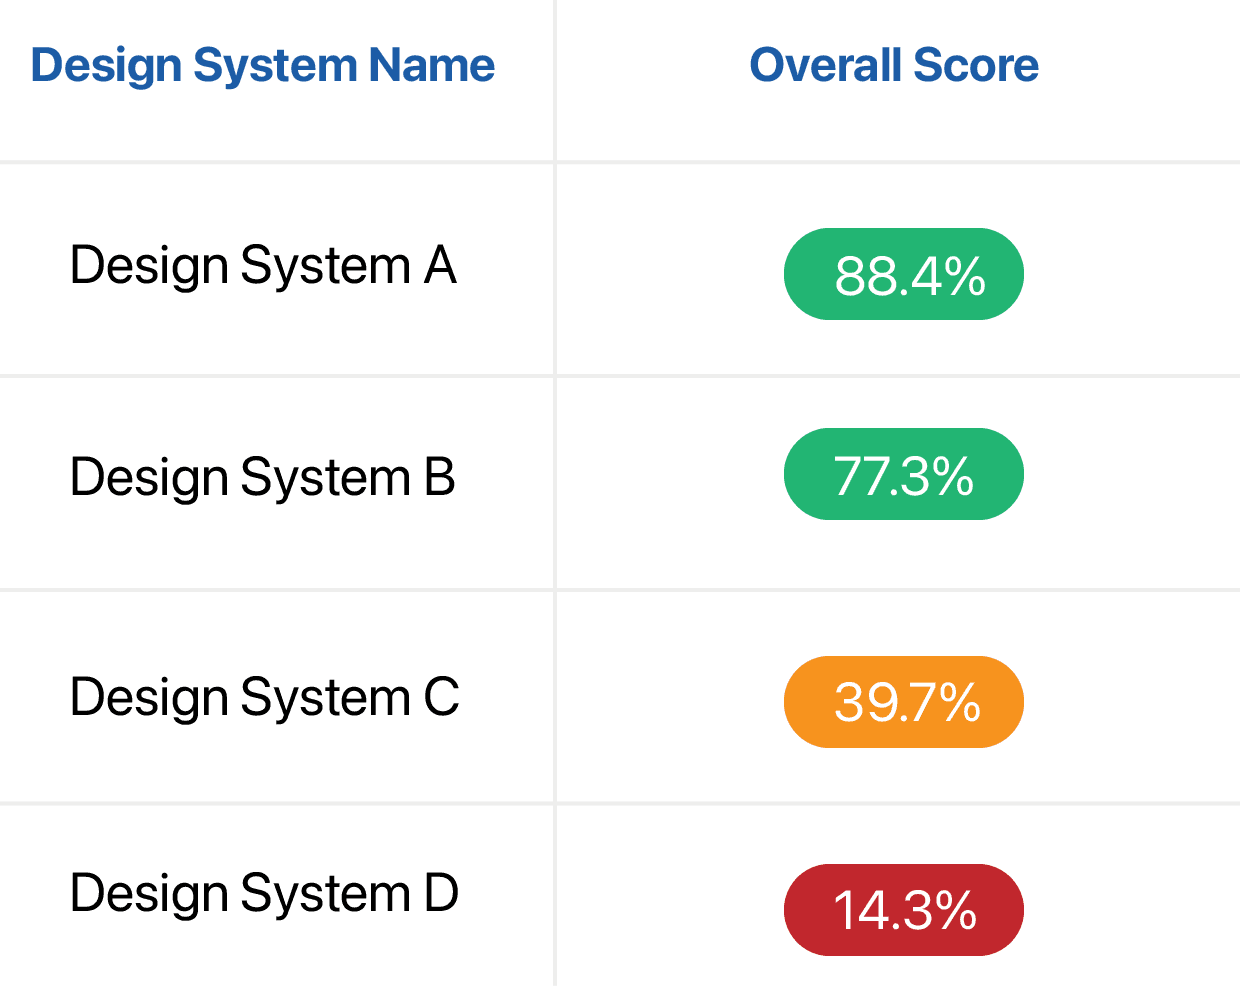
Normalised the data to establish a reliable design system ranking. This enabled my client to discern the most effective overall design system and identify the components of each system that should be retained.
Composed a comprehensive report for each design system, outlining its respective strengths and weaknesses.
The calculations for how data was normalised and how a ranking system was developed can be viewed by clicking the button below
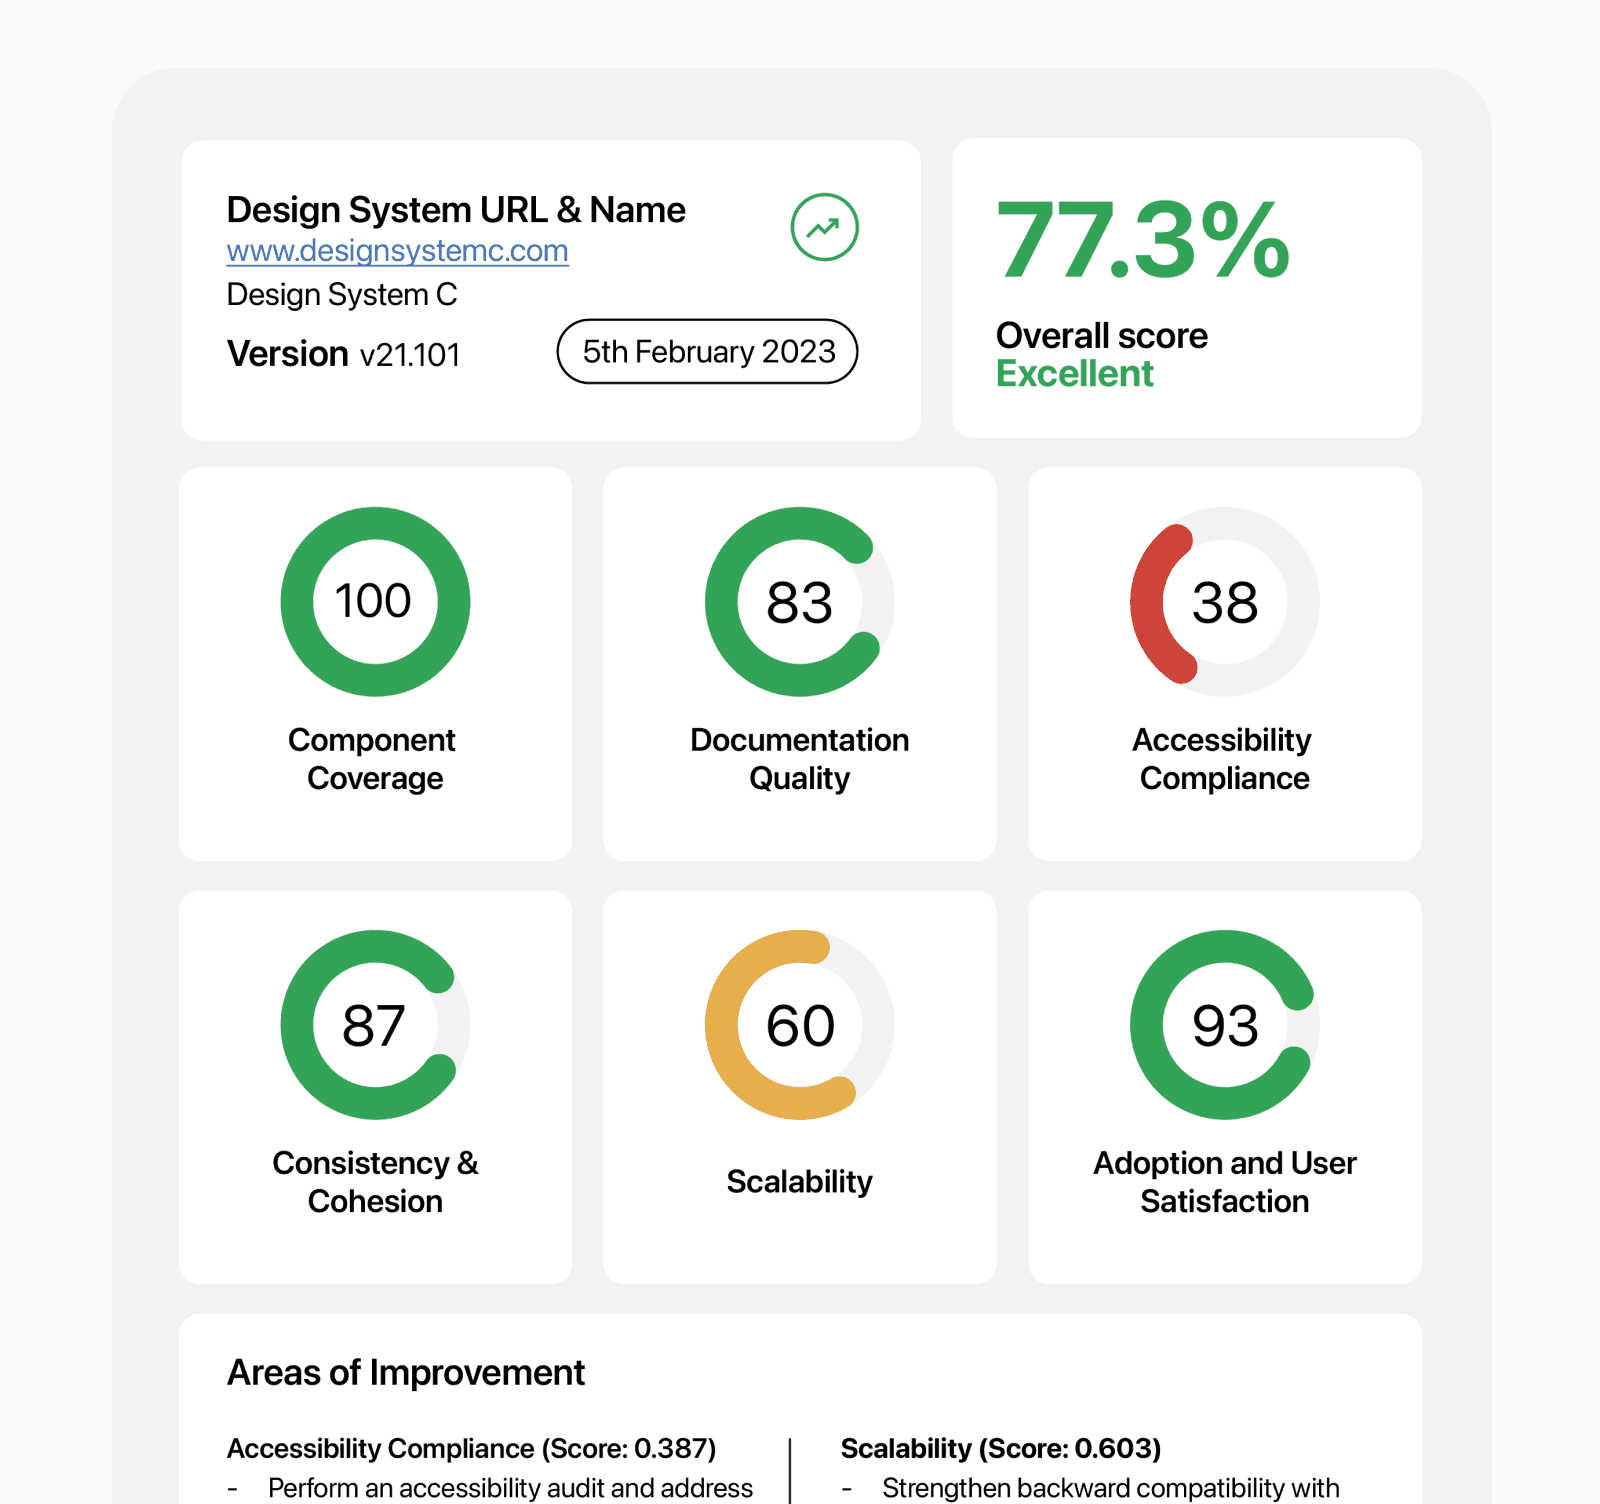
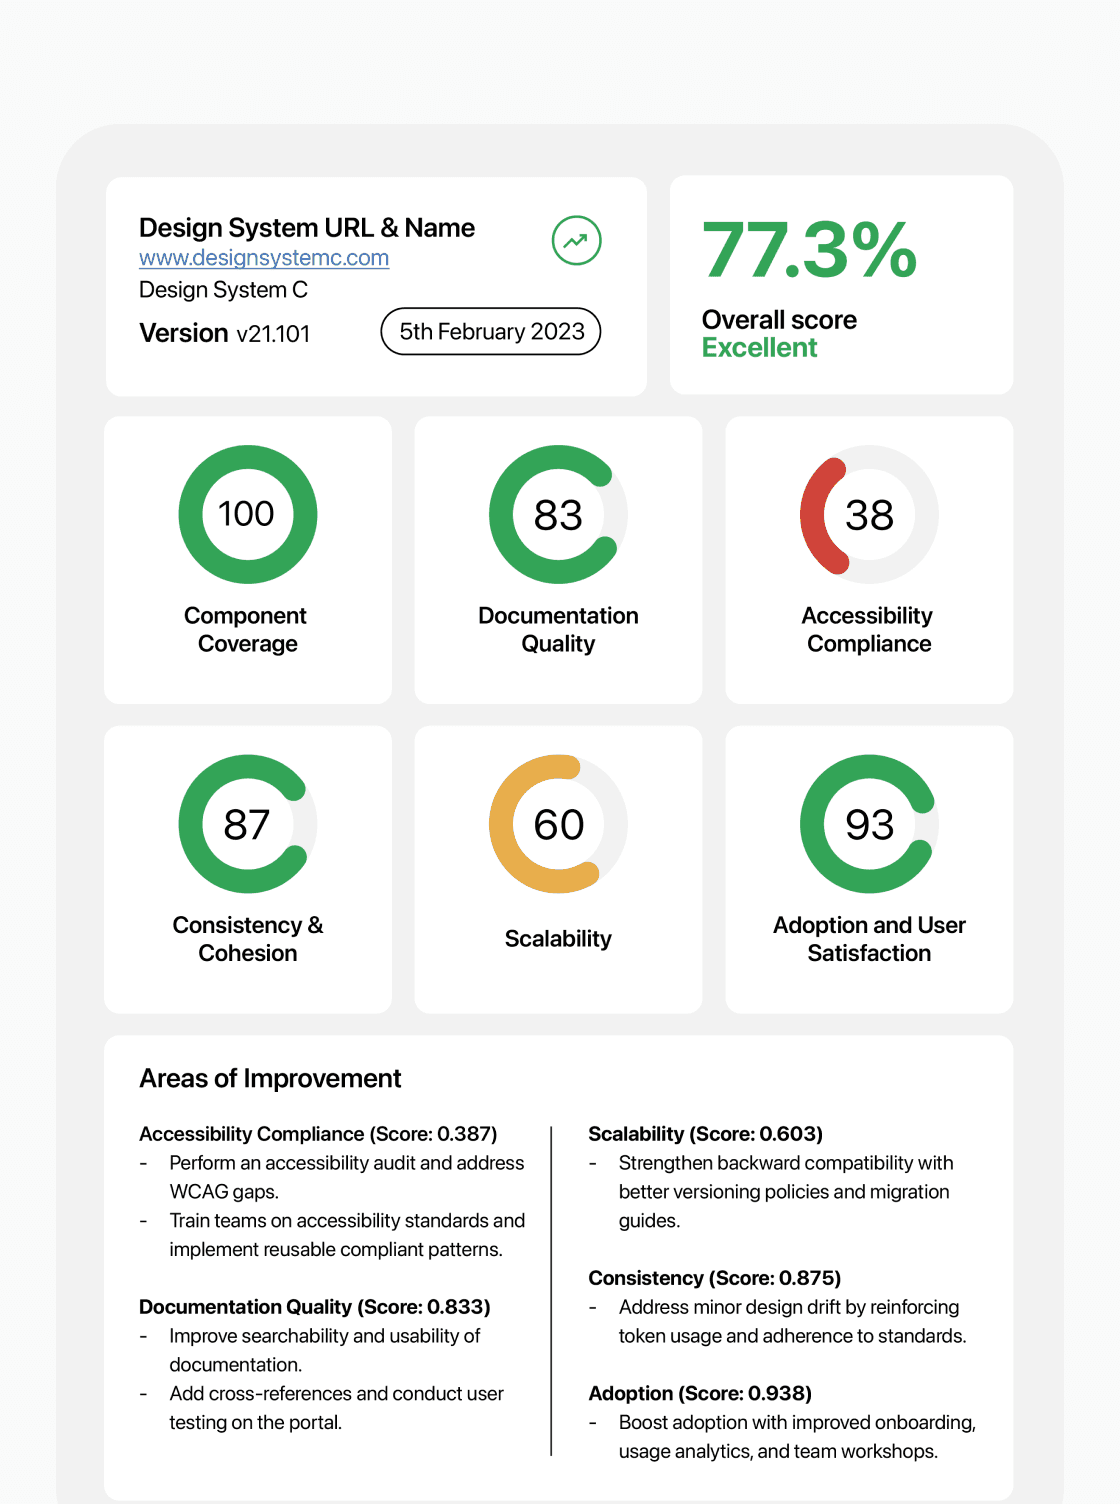
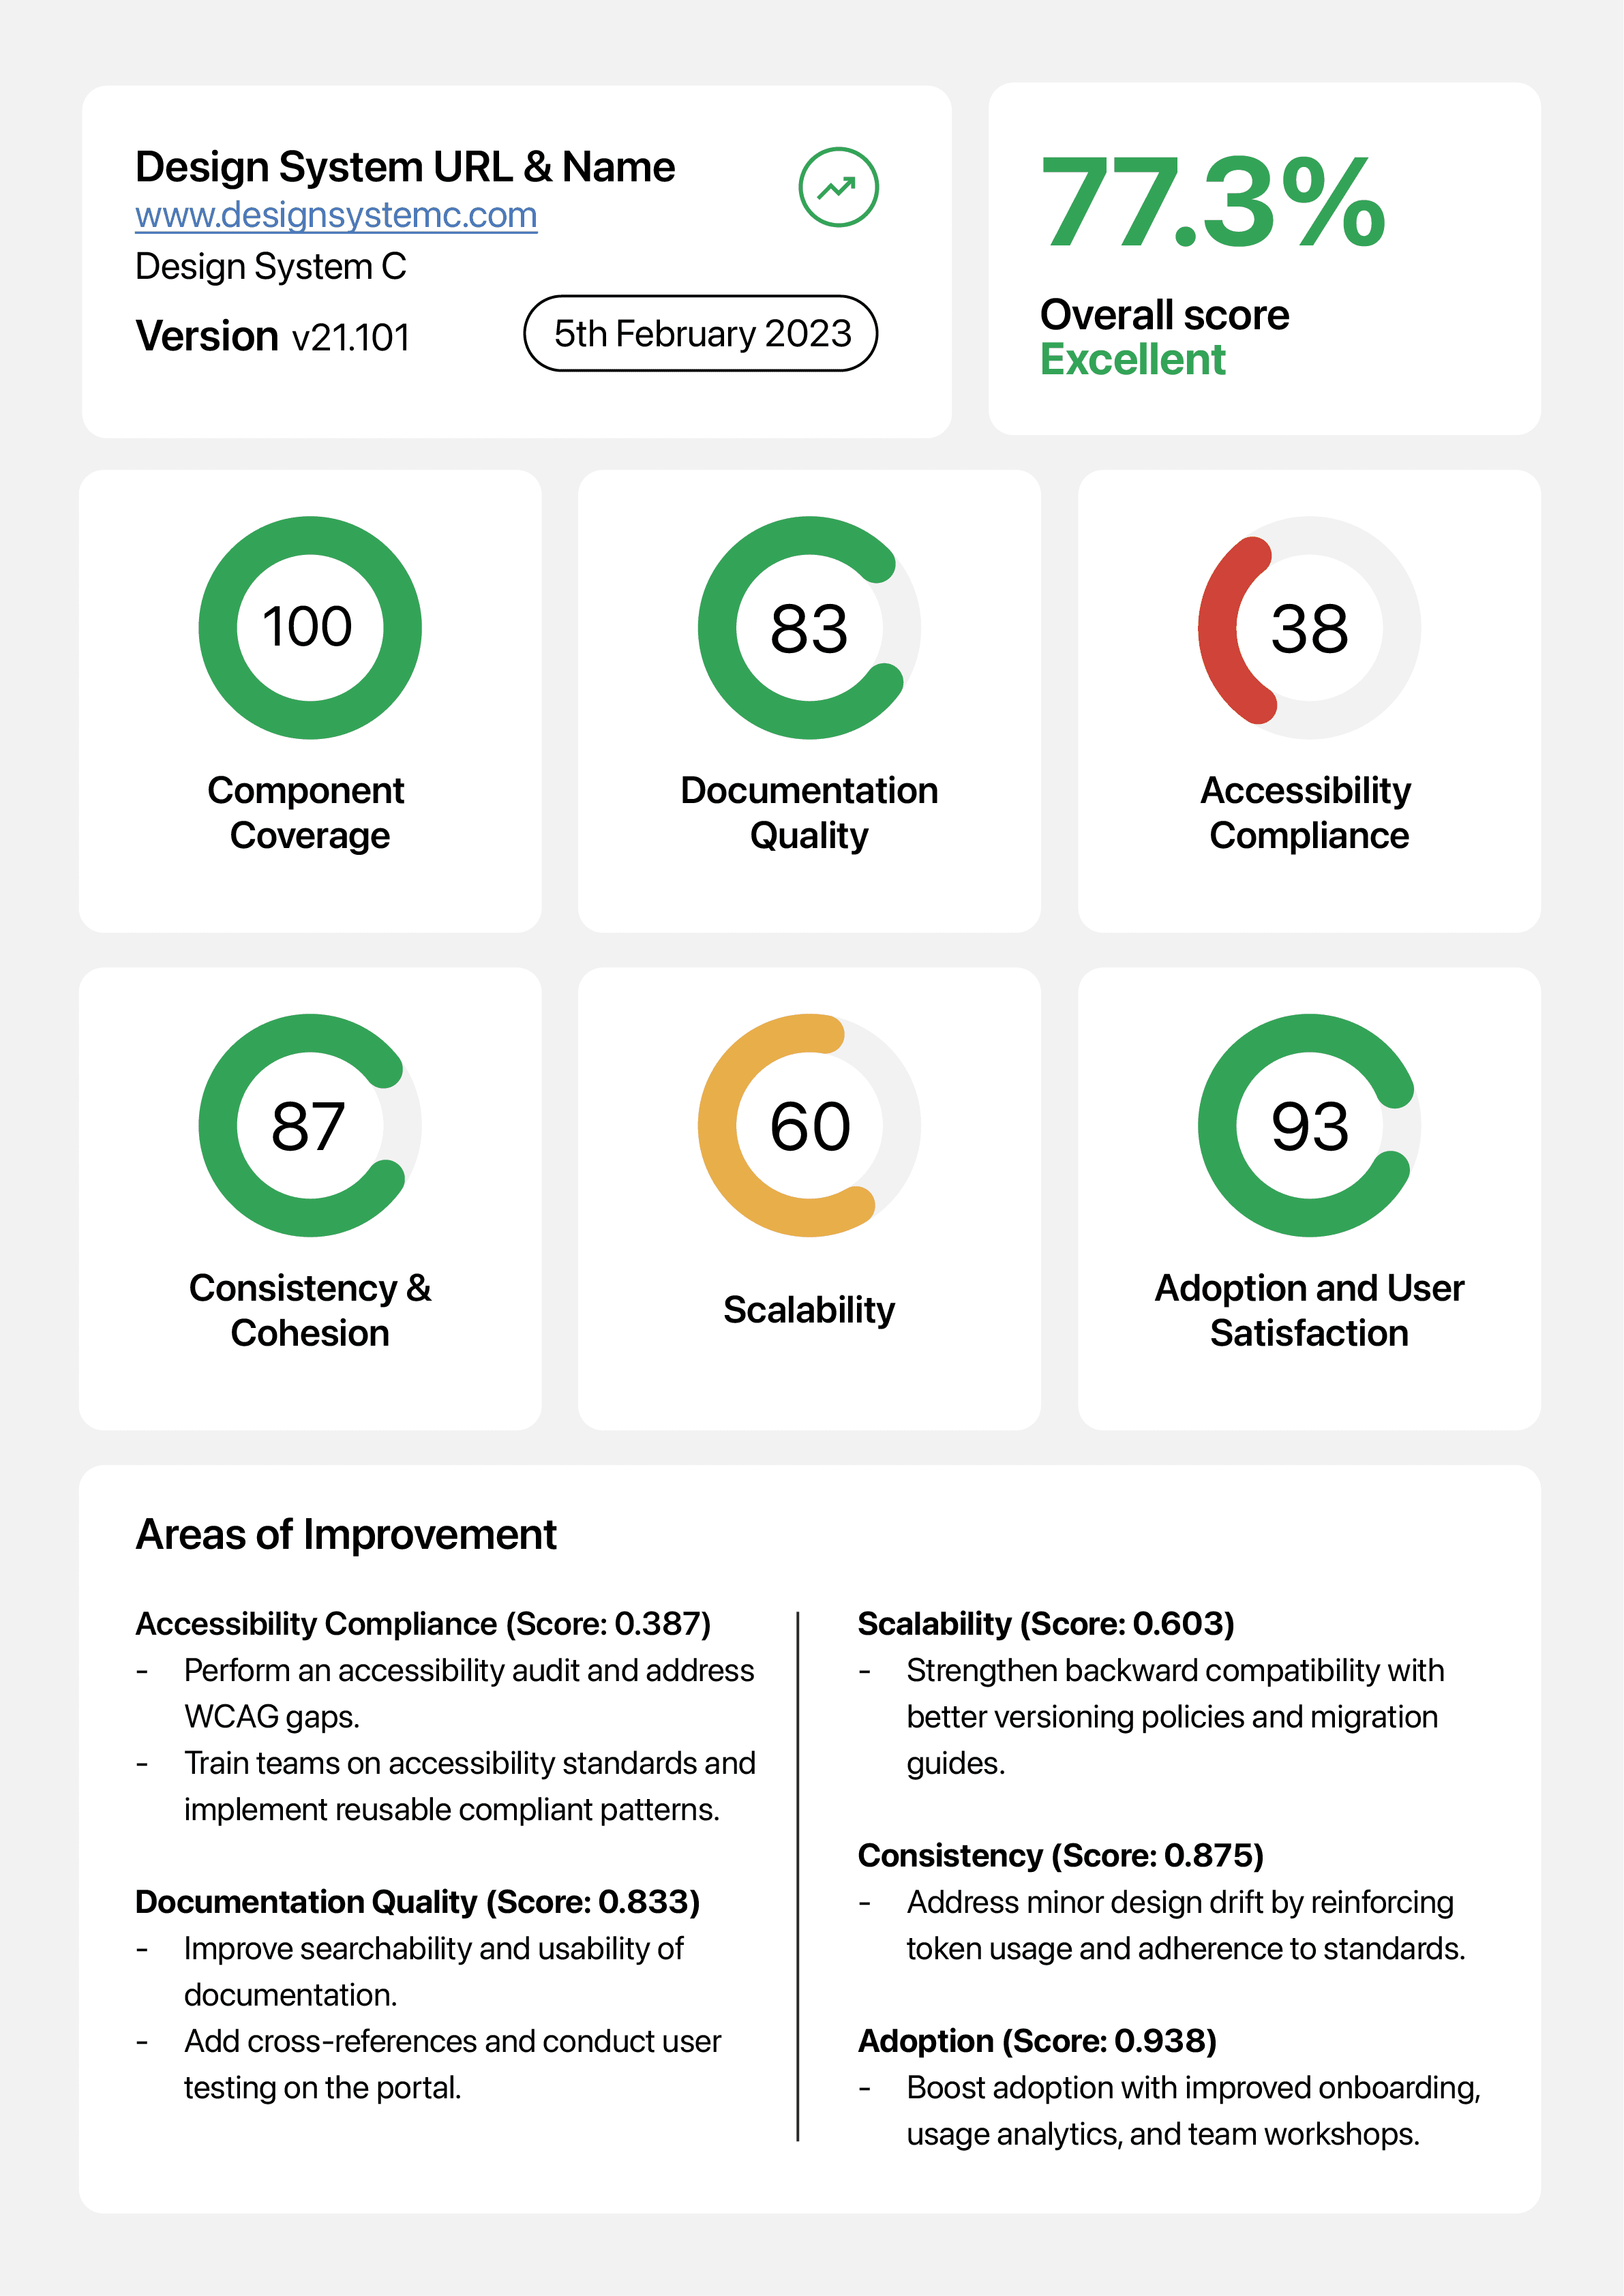
Design System Report
This report was shared with the teams working on the individual design systems and it assisted in overall decision making across the company. The report includes scores for each category and suggestions on how the design system could be improved.
© Kevin Morris 2024-2025